After having failed to give any sustainable breakout above the 11760 levels, as well as having resisted to the lower trend line of the upward rising channel (which was breached on the downside in October 2018), the NIFTY finally gave up and ended the week with a cut. The Indian equity markets continued to correct throughout the week and ended negative on each working day. Having ended on a negative note for the eighth consecutive day, the NIFTY closed the week with a net loss of 433.35 points (-3.70%).
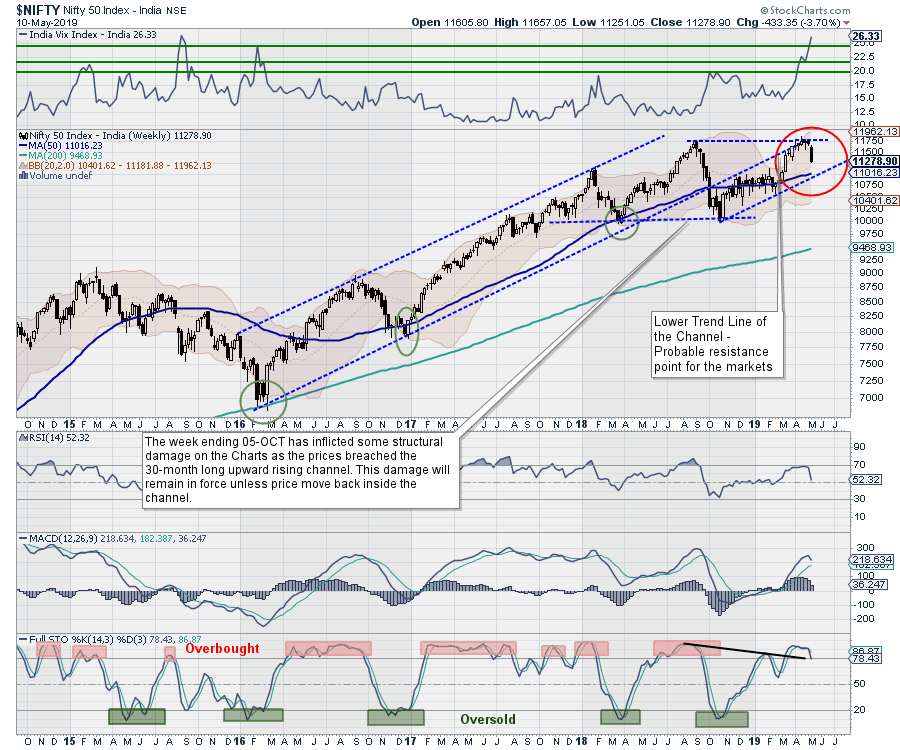 We had mentioned in our previous weekly note that, despite attempts to move past the 11760-mark, the short-term technical structure remains bearish. The VIX rose once again this week by 9.58% to 26.33, trading at levels seen only in 2015. The markets had run-up much ahead of the curve, while the growing caution ahead of General Election results took a toll on the markets in general, which were showing bearish divergence against its lead indicators over the past several weeks.
Given the kind of fall that we witnessed in the previous week, there is a chance that we see the market attempt to stabilize and give some technical pullback. However, all these pullbacks, if there are any, will have limited upside potential, while the level of 11550 will continue to pose strong resistance at higher levels.
We expect a sober start to the week. The 11390 and 11550 levels will pose formidable resistance to any upside that the markets may attempt. On the downside, the supports come lower at 11100 and 10930.
The weekly RSI stands at 52.3236; it remains neutral and does not show any divergence against the price. The weekly MACD is bullish as it trades above its signal line, but it is seen narrowing its trajectory. A big black body emerged on the candles. This signifies the credibility of the resistance that lies in the 11550-11600 zone.
The pattern analysis of the weekly charts evidently shows that the NIFTY resisted not only to the 11760 mark, but also the lower trend line of the 30-month long upward rising channel that the index breached on the downside in October 2018. If we look for pattern supports, those comes in the form of a rising trend line drawn from 10000 levels, which join subsequent higher tops. This pattern support exists near the 50-Week MA, which is presently at 11016.
We strongly recommend avoiding chasing the pullbacks, if there are any. Chasing pullbacks will have much lower risk-reward ratio and the NIFTY faces strong resistance near the 11550 levels. All exposures should be kept limited to defensive stocks while maintaining a highly cautious view for the coming week.
Sector Analysis for the Coming Week
In our look at Relative Rotation Graphs, we compared various sectors against CNX500, which represents over 95% of the free float market cap of all the stocks listed.
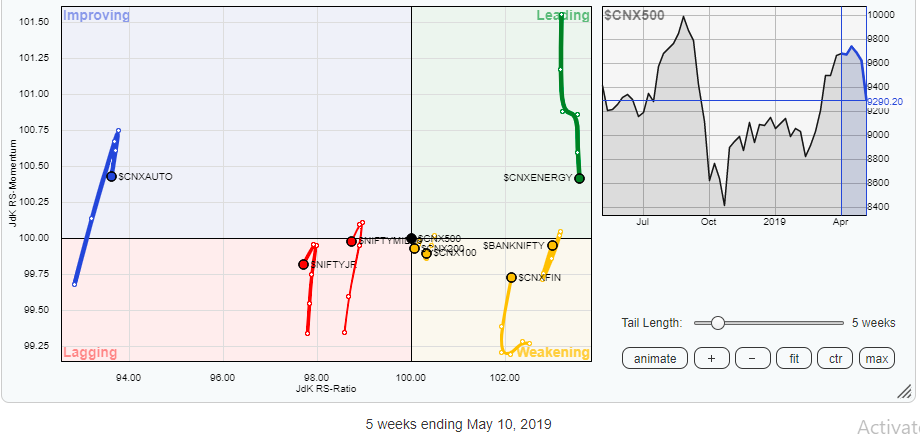
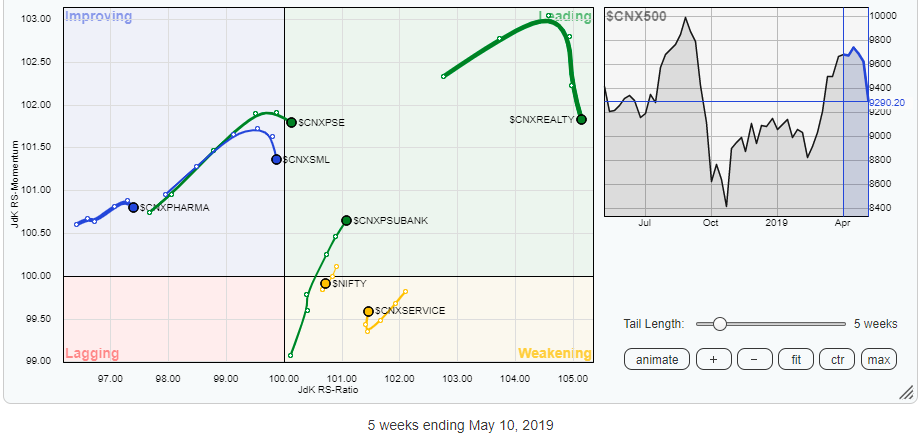 The review of Relative Rotation Graphs (RRG) shows that we can expect relative out-performance from the PSE and the PSU Bank group. These indexes are in the leading quadrant and are maintaining their momentum against the broader CNX500 index. The Realty and Energy Index are losing their momentum while continuing to remain in the leading quadrant. BankNifty is expected to attempt to find some bottom and consolidate.
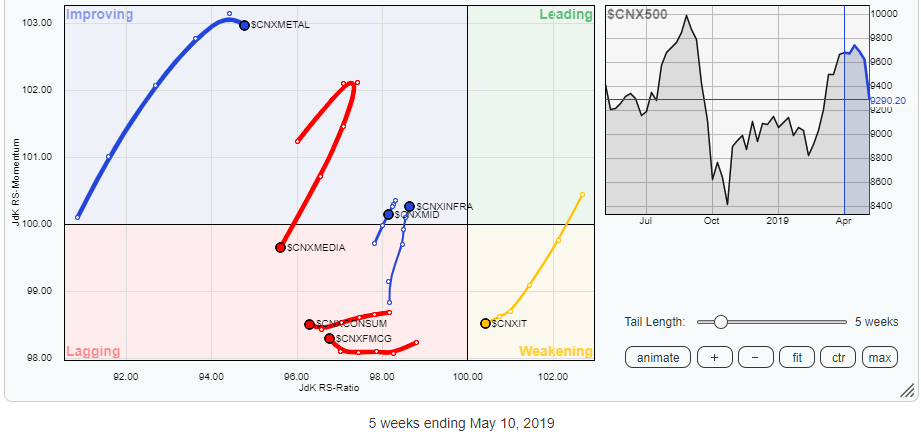
We can also expect some relative out-performance from the Infra, Metal and Pharma indexes as they remain in the improving quadrant. They are also seen maintaining and slightly improving their relative momentum against the broader markets.
No major performance is expected from the FMCG, Consumption, Auto, Media and IT groups, barring a few stock-specific actions within them.
Important Note: RRG™ charts show you the relative strength and momentum for a group of stocks. In the above chart, they show relative performance as against NIFTY500 Index (Broader Markets) and should not be used directly as buy or sell signals.
Milan Vaishnav, CMT, MSTA
Consulting Technical Analyst
www.EquityResearch.asia


