The end of the previous week saw the NIFTY taking support at its 50-Week MA but making a downward breach on the downside from the secondary channel, which was formed after the NIFTY breached the primary uptrend in October 2018. The week that went by saw the index extending its losses. The past couple of days has remained very volatile, with the benchmark index going on to test its 100-Week MA. The index ended the week with a net loss of 286.95 points (-2.54%). The India Volatility Index VIX shot up by 25.18% to 15.19.
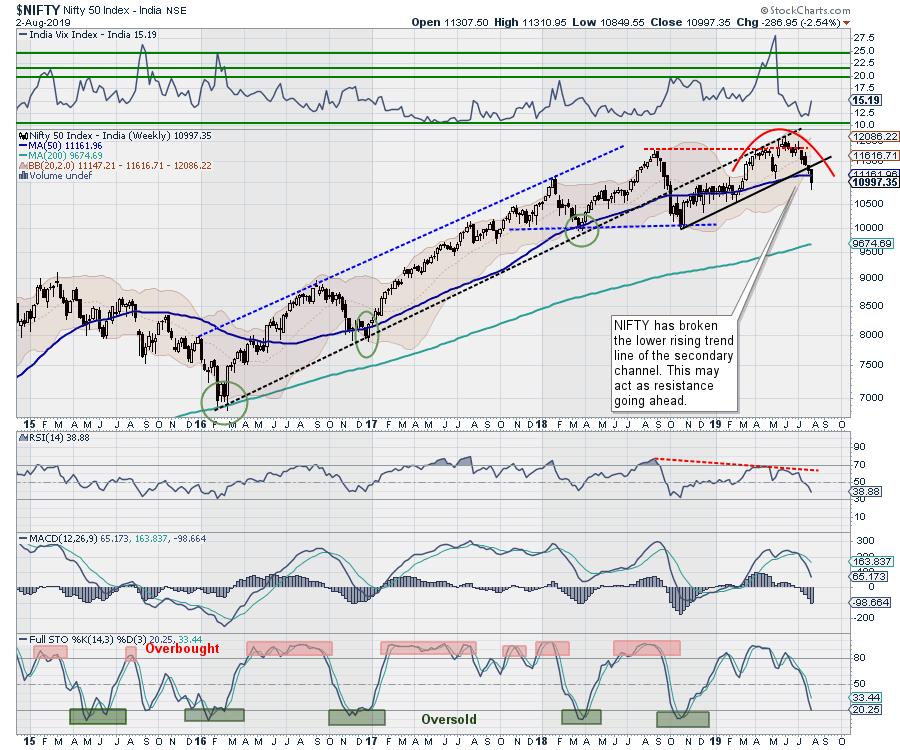
The past week has damaged the technical structure of the markets in general and warrants a fundamental look on the broader technical picture for the medium-term. The Index has completed a Rounding Top formation on the weekly charts. Such a pattern is inherently bearish in nature; it remains fractal in nature and also appears on the shorter time-frame charts. Within this structure, there are two important data points: the first top of the NIFTY and the lower high that followed it (and made it even more bearish).
Given the oversold nature of the markets, that we may see a positive opening to the week should not come as a surprise. There is enough room for some pullback in the initial week. However, going forward, we will see that the potency of such pullbacks will be challenged and remain more vulnerable to selling pressures from higher levels.
The coming week will see the levels of 11080 and 11180 acting as resistance points; supports will come in at 10850 and 10700. The range and volatility are expected to remain wider over the coming days.
The weekly RSI stands at 38.88; it has marked a fresh 14-period low and is bearish. The RSI does not show any divergence against the price. The weekly MACD is bearish and trades below its signal line.
There needs to be a tactical change in the way we approach the markets over the coming days. Any technical pullbacks that we may see due of the NIFTY being oversold on the daily charts will remain uptrends during a secondary trend. For the short-term traders, it would make sense to chase the pullbacks when and as they occur, but the profits will have to be very vigilantly protected at higher levels. For market participants with a medium-term time horizon, now is perhaps the time to make a tactical shift to safer and defensive stocks and churn their portfolios accordingly. A continued cautious outlook is advised for the week.
Sector Analysis for the Coming Week
In our look at Relative Rotation Graphs, we compared various sectors against CNX500 (NIFTY 500 Index), which represents over 95% of the free float market cap of all the stocks listed.
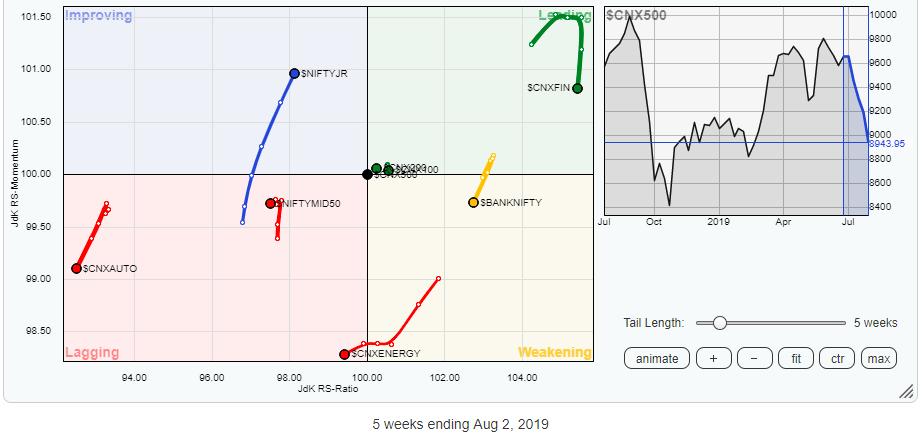
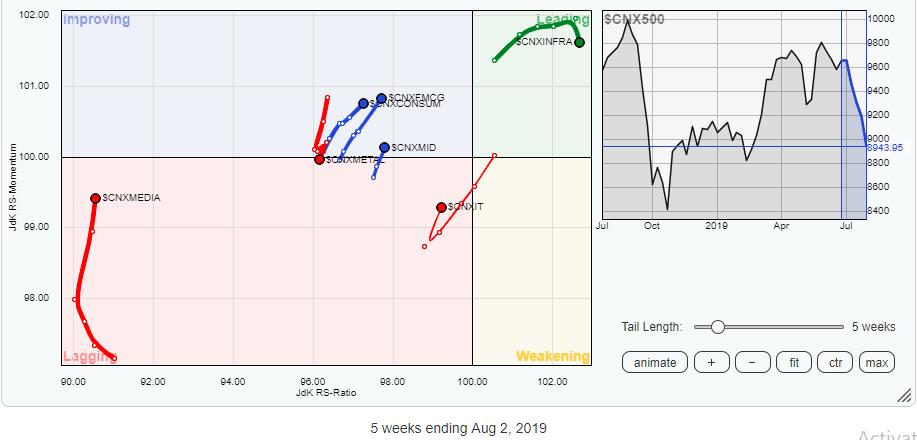
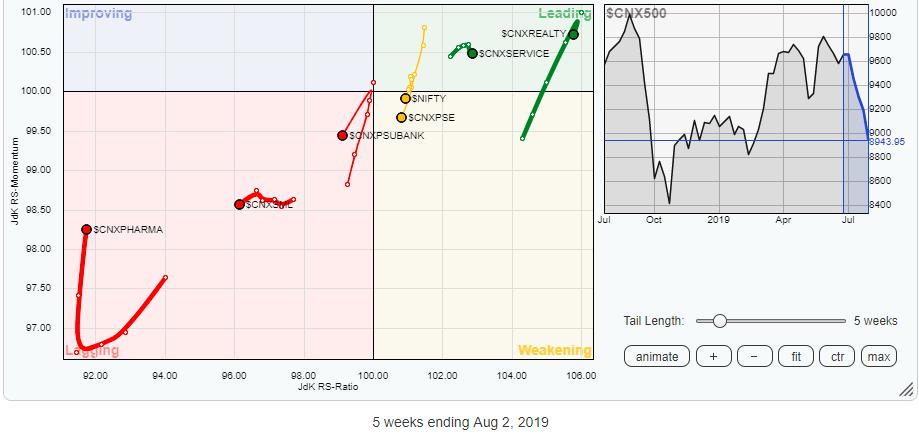
The review of Relative Rotation Graphs (RRG) shows that there is no single sector that lies comfortably in the leading quadrant. The Infrastructure, Services, Realty and Financial Services Sectors remain in the leading quadrant, but they are either slowly losing their relative momentum or making very tentative moves in a very cautious manner. However, stock-specific performances can be expected from these groups.
All the other crucial sectors, such as Auto, Energy, BankNIFTY, Metals, CPSE and PSU Bank Indexes, are all seen heading lower while mostly remaining in the lagging and weakening quadrant.
The IT sector has shown a sharp turn and has improved its relative momentum. The FMCG and Consumption Indexes are in the improving quadrant; together, these three groups are likely to post relative out-performance against the broader markets collectively in the coming days.
Important Note: RRG™ charts show you the relative strength and momentum for a group of stocks. In the above chart, they show relative performance against NIFTY500 Index (Broader Markets) and should not be used directly as buy or sell signals.
Milan Vaishnav, CMT, MSTA
Consulting Technical Analyst


