In the week before this past week, the NIFTY rested itself and took support on the lower rising trend line of the nine-month-long secondary channel that had been formed. This secondary channel was formed after the index breached its three-year-long upward rising channel in October 2018. In the previous weekly note, we had mentioned that, if this pattern support is breached on the downside, it may invite further weakness in the markets and the NIFTY may move towards testing its 50-Week MA. This past week saw the bearish undertone persisting; the index ended the week having lost 134.95 points (-1.18%).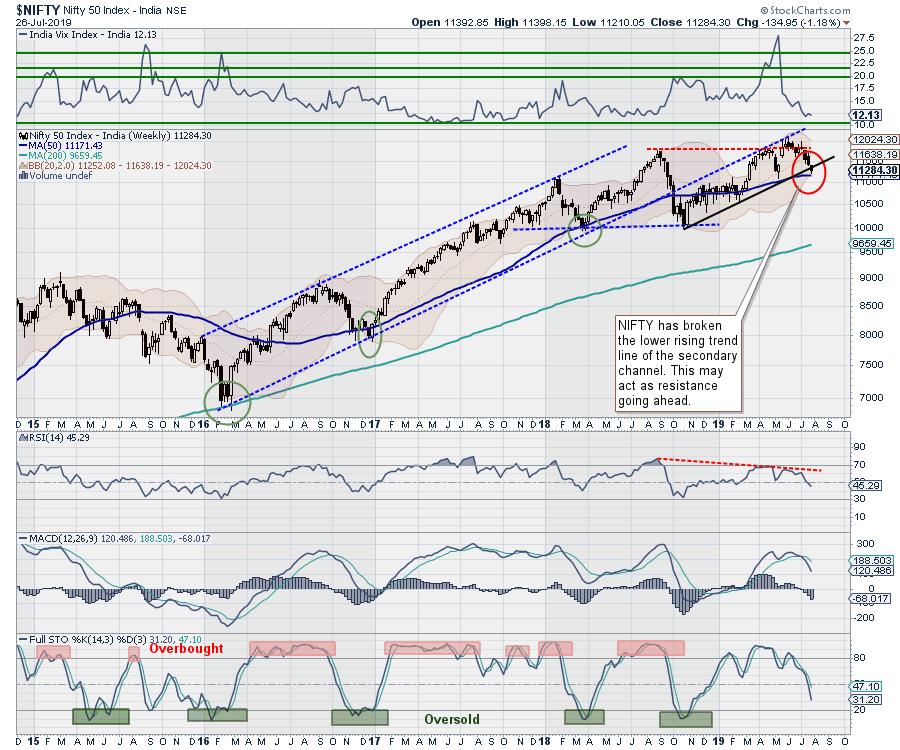
During the week that ended this Friday, the NIFTY closed below its pattern support that existed in the form of a lower rising trend line. This has increased the possibilities of the NIFTY moving towards its 50-Week MA, which presently stands at 11171. This level remains in proximity to the 200-Day MA, which stands at 11135. The index remains oversold on the short-term time frame. Though the upside may remain limited, a technical pullback is likely. On the lower end, the zone of 11135-11170 will be crucial to watch.
Despite such a breach of the pattern support, the NIFTY remains oversold on the short-term timeframe charts. Being oversold on a couple of lead indicators may help NIFTY arrest its downside momentum temporarily and even aid in a technical pullback. A positive start to the week is expected, and some follow-up technical pullback may continue. Such pullback, if at all it occurs, may be sharp but limited to an extent. On the other hand, if, instead of an overdue pullback, the NIFTY oscillates in a range and enters some consolidation, it may open up a fresh downside.
The coming week will see the levels of 11375 and 11450 acting as resistance. while supports will come in at 11130 and 10950.
The weekly RSI stands at 45.3049. It has marked a fresh 14-period low, which is bearish, and also shows a bearish divergence - the RSI marked a new 14-period low, but the NIFTY did not do so. The weekly MACD is still bearish as it trades below its signal line. No crucial formations were noticed on the Candles.
In the present technical structure, the markets sit on a double-edged sword. Given the oversold nature of the markets on important lead indicators, a pullback remains imminent and overdue. On the other hand, if, in place of a sharp pullback (very likely), the markets enter a range-bound consolidation, it will create space for some extended downsides going ahead.
In the current setup, it will be wise to stay away from creating any shorts. While avoiding shorts, purchases may be made, while all profits should be protected vigilantly at higher levels. We advise continuing to keep exposures at modest levels and maintaining a cautious outlook in the coming week.
Sector Analysis for the Coming Week
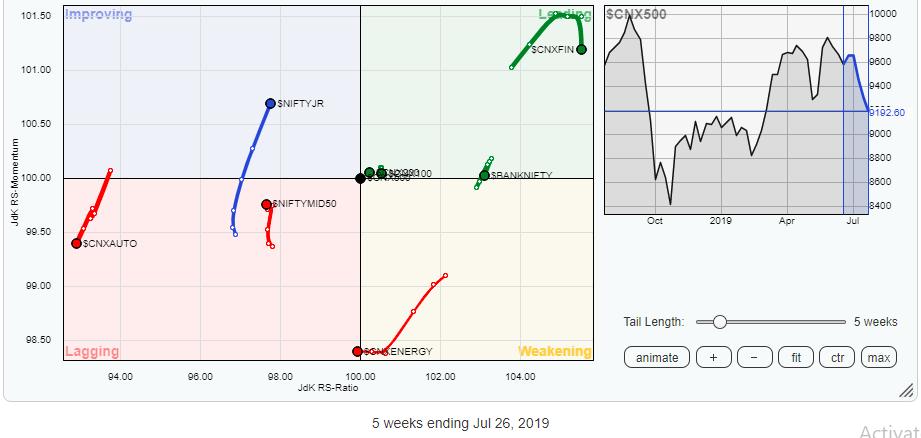
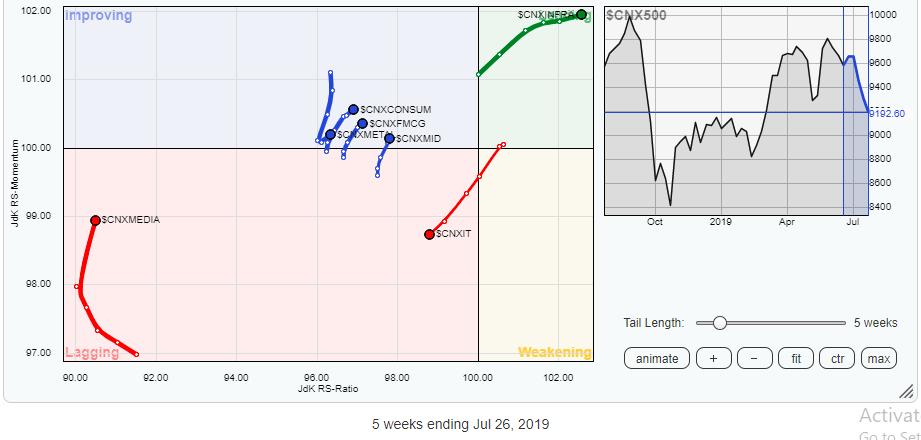
In our look at Relative Rotation Graphs, we compared various sectors against CNX500 (NIFTY 500 Index), which represents over 95% of the free float market cap of all the stocks listed.
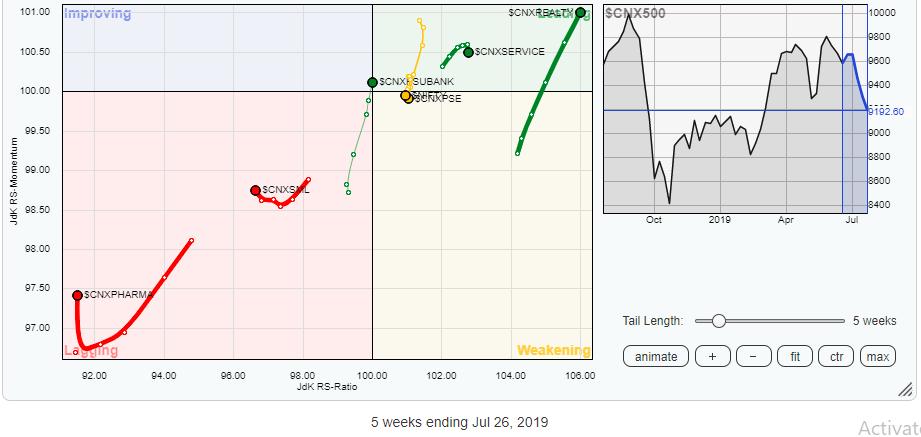
The review of Relative Rotation Graphs (RRG) shows the Infrastructure and Realty Indexes are placed in the leading quadrant. These indexes are likely to continue to relatively outperform the broader markets. On the other hand, BankNifty, the Financial Services Index and the Services Sector Index have taken a turn and are seen losing relative momentum. These indexes may falter going ahead. The PSU bank index is also in the leading quadrant and may show resilience compared to other sectors.
The IT index, along with Energy and Auto indexes, is seen drifting lower and staying in the lagging quadrant. These groups are likely to relatively underperform the markets.
The Consumption and FMCG index are inching higher in the improving quadrant and participating in selective out-performance, along with the sectors that are placed in the leading quadrant. Stock specific out-performance can be expected from these pockets.
Important Note: RRG™ charts show you the relative strength and momentum for a group of stocks. In the above chart, they show relative performance against NIFTY500 Index (Broader Markets) and should not be used directly as buy or sell signals.
Milan Vaishnav, CMT, MSTA, Consulting Technical Analyst


