Following the announcement of fiscal stimulus on Friday, the market extended its gains in the following week, but, at the same time, also consolidated at higher levels. After some more follow-up up moves in the first half of the week, the second half was spent in some volatile consolidation and some profit-taking at higher levels. The NIFTY came off 180-odd points from its highest point before closing the week with a net gain of 238.20 points (+2.11%).
The signs of some exhaustion and profit-booking were visible in the markets during the last two days of the trade. The coming week is a truncated one, with Wednesday being a trading holiday on account of Gandhi Jayanti; the week is also set to remain volatile and witness some broad-based consolidation, with profit-taking at higher levels likely. Over the past couple of days, the Indian Volatility Index (INDIA VIX) has risen to 16.11 from the low of 12.30.
The new week is likely to see a subdued start and, in the event of any up move, the 11600-11700 zone will pose stiff resistance to the markets. The weak global markets and impending tension in the Gulf vis-à-vis Saudi Arabia and Iran may trigger some risk-off in the global markets, though to a limited extent.
The coming week will see the levels of 11645 and 11730 acting as resistance points. Supports come in at 11410 and 11330. In the event of any consolidation or profit-taking, the range for the coming week is expected to be wider-than-usual.
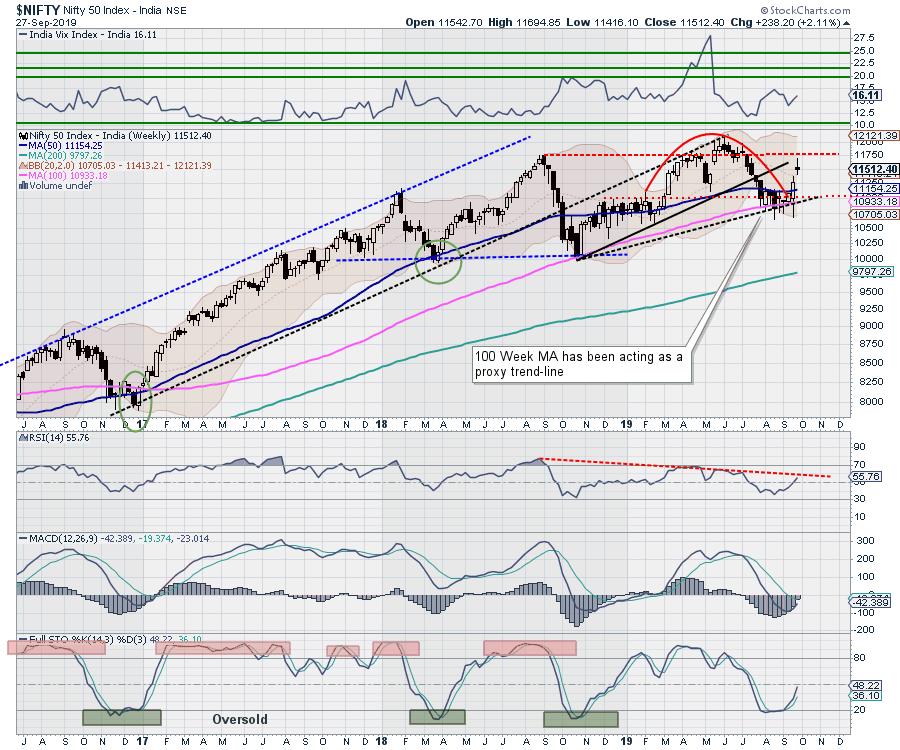
The RSI on the weekly chart is 55.7654; it remains neutral and does not show any divergence against the price. The weekly MACD is bearish and trading above its signal line. A rising window occurred on the candles. Such a formation results out of a gap; however, in the present setup, this formation may not be as potent given the overstretched nature of the markets.
The pattern analysis shows that the NIFTY bounced out the 100-Week MA, which has been acting as a proxy trend line over the past number of weeks. As of today, it has taken support at a short-term 20-Week MA, which is presently at 11413. Any slip below this level will infuse weakness in the markets.
The signs of some money being taken off the table were visible as the consolidation and minor downside on Friday has come with shedding of OI in the derivative segment. The RSI, which is a lead indicator, does not show any divergence, but it is marking a lower top and is not rising with as much vigor as the markets. A couple of lead indicators also remain in the overbought zone on the daily charts. This overstretched setup on the short term charts is likely to prevent any sustainable up move in the immediate short term. While curtailing high volume purchases, the markets may be approached with a precautionary mindset and in a cautious way.
Sector Analysis for the Coming Week
In our look at Relative Rotation Graphs, we compared various sectors against CNX500 (NIFTY 500 Index), which represents over 95% of the free float market cap of all the stocks listed.
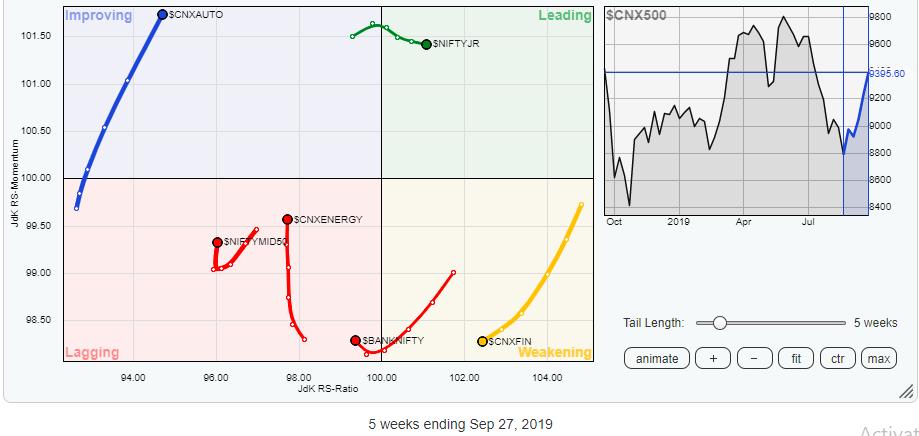
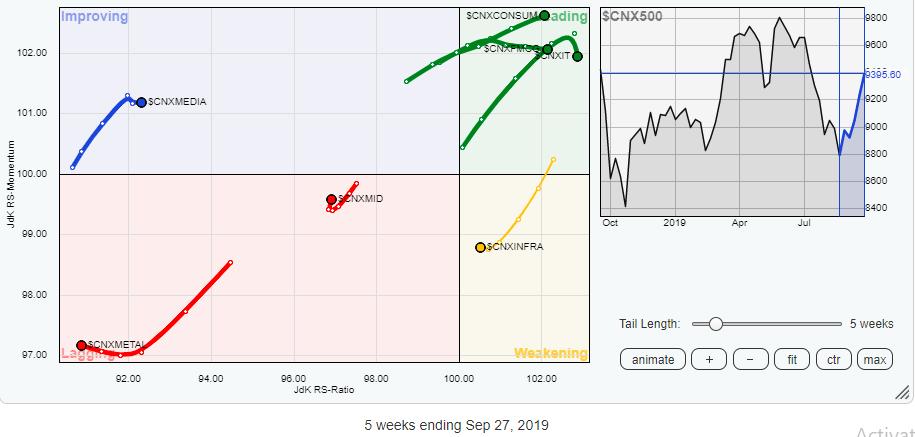
Our review of Relative Rotation Graphs (RRG) shows some attempts of revival in the Nifty Energy Index. The Energy Index, though it continues to remain in the lagging quadrant, is showing a steep rise in relative momentum over the past couple of weeks. Along with this, we have the Consumption and FMCG indexes firmly placed in the leading quadrant. The Auto Index also is steadily advancing while remaining in the improving quadrant. These groups are likely to remain resilient to any downsides and will continue to relatively outperform the broader markets.
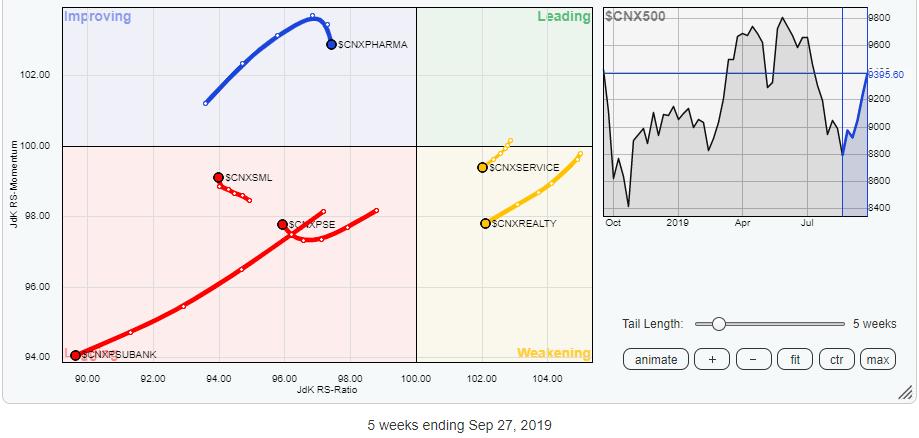
The NIFTY Pharma and Media indexes are seen faltering as they remain in the improving quadrant. They are expected to continue to relatively underperform unless they pick up on their momentum, which seems stalled.
The Financial Services, BankNifty, Metal, Services Sector, Realty and PSU Bank indexes are seen steadily losing momentum. They may relatively underperform the broader markets.
Important Note: RRG™ charts show you the relative strength and momentum for a group of stocks. In the above chart, they show relative performance against NIFTY500 Index (Broader Markets) and should not be used directly as buy or sell signals.
Milan Vaishnav, CMT, MSTA
Consulting Technical Analyst,


