The week remained positive for the Indian equities as the benchmark index closed with week with net gains. The markets witnessed up-moves over the past couple of days, but those were fueled mostly by short-covering, which was triggered from the lower levels. The NIFTY successfully defended the critical support levels on the weekly charts, while the volatility index (INDIAVIX) dropped by 13.24% to 14.12. The index ended with weekly gains of 129.70 points (+1.18%).
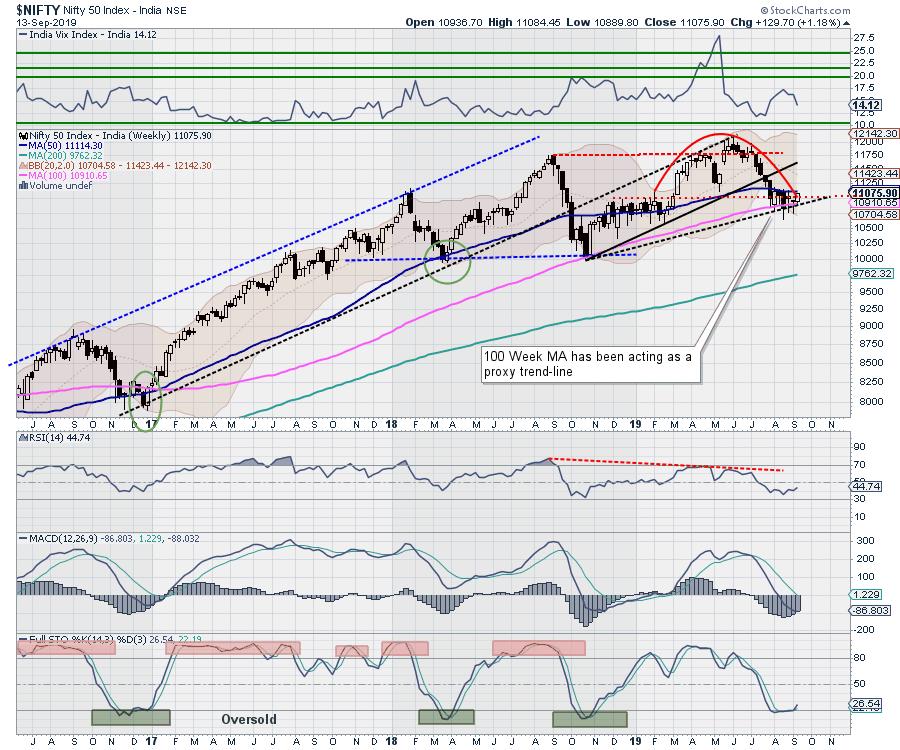
In the previous weekly note, we had mentioned the then 100-Week MA, which stood at 10901 at the time, to be the most critical level to watch. The NIFTY recovered from the weekly low of 10889.80 and has defended this level at Close. For the coming week, the 100-Week MA, which presently stands at 10910, will once again a pivotal level to watch. The 100-DMA is seen acting as a proxy trend line and will be the most critical level to defend for the NIFTY on a closing basis.
While we should have a stable start to the week, we expect the levels of 11150 and 11230 to act as resistance. Supports are expected to come in at 10980 and 10800.
The Relative Strength Index (RSI) on the weekly chart is 44.7441; it remains neutral and does not show any divergence against the price. The weekly MACD is still bearish and trading below its signal line.
The pattern analysis on the weekly charts shows that the NIFTY marked its lifetime high, followed by a lower top; in the process, it completed a rounding top formation. Following the creation of a rounding top, the NIFTY eventually breached the neckline on the downside, but has taken support on its 100-week MA so far. Presently, it trades near the neck-line area.
The derivatives data indicates that the previous week has seen lot of short covering from lower levels. However, there is still absence of strong buying support, which is required for any sustainable up move to happen. The 50-Week MA of the NIFTY presently stands at 11114, while the 200-Day MA is at 11222. This zone of 11110-11220 will be challenging to navigate for the NIFTY unless supported by healthy buying. We recommend not getting carried away with any up moves unless the NIFTY closes above the 11220 level convincingly. Until this happens, we reiterate dealing with the market with caution and with a stock-specific approach.
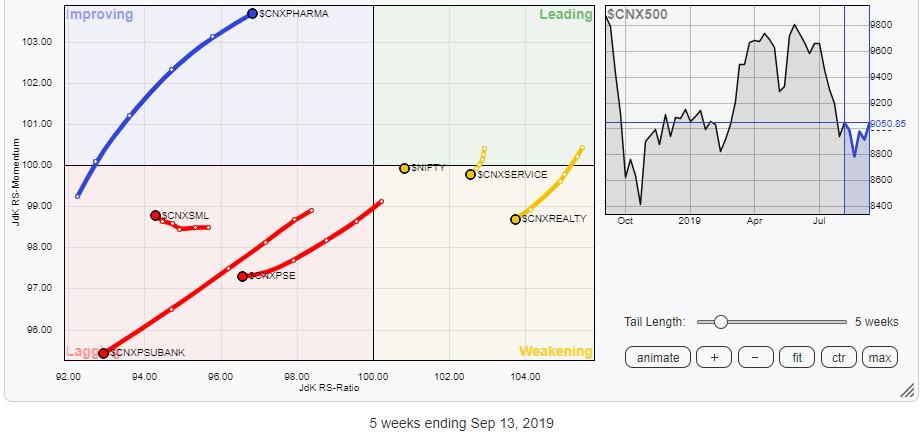
Sector Analysis for the Coming Week
In our look at Relative Rotation Graphs, we compared various sectors against CNX500 (NIFTY 500 Index), which represents over 95% of the free float market cap of all the stocks listed.
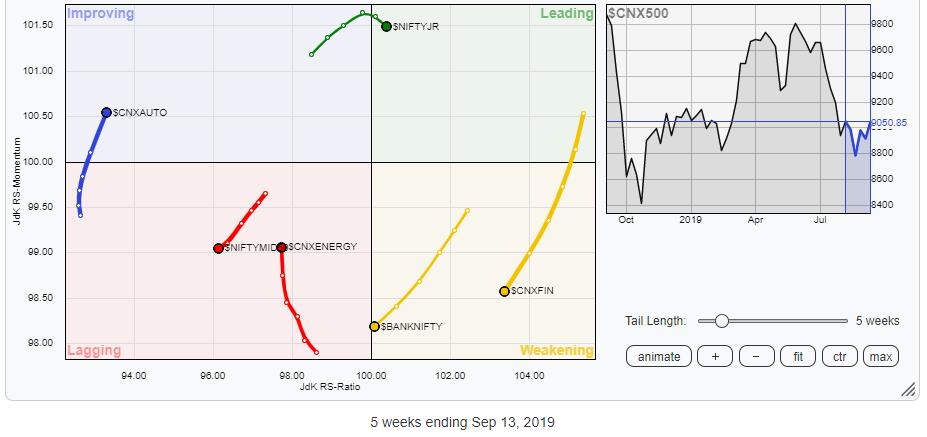
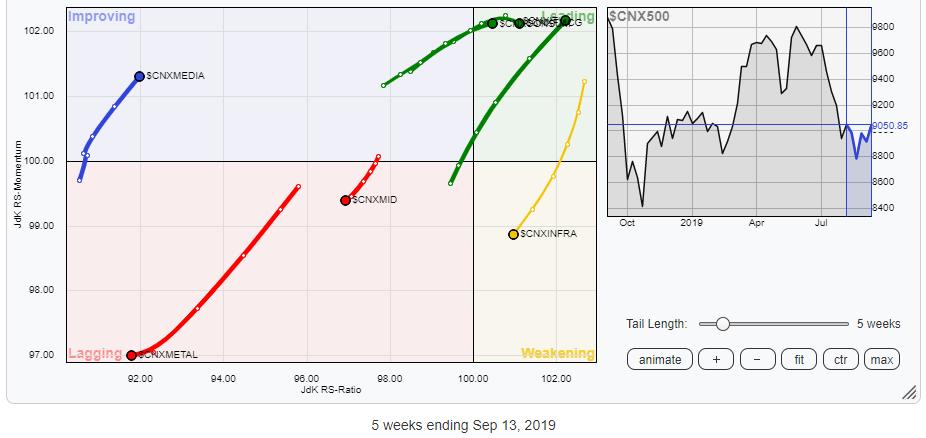
The review of Relative Rotation Graphs (RRG) continues to depict a similar picture, with just a handful of sectors favorably placed. The Consumption, FMCG and IT indexes are placed firmly in the leading quadrant; these groups will continue to relatively outperform the broader markets.
In addition, the Auto and Pharma indexes have continued to advance further in the improving quadrant, and they will continue to show resilience and some stock-specific outperformance over the coming days.
Though the banking stocks showed some volatility, the PSUBank Index and the BankNIFTY are seen consistently losing their momentum. The PSE, CPSE, Realty, Services, Financial Services and Infrastructure groups are losing their relative momentum and may not offer any noteworthy performance of the coming days.
Important Note: RRG™ charts show you the relative strength and momentum for a group of stocks. In the above chart, they show relative performance against NIFTY500 Index (Broader Markets) and should not be used directly as buy or sell signals.
Milan Vaishnav, CMT, MSTA
Consulting Technical Analyst,


