While trading in a broad range, the NIFTY struggled to find some base and managed to end the week with modest gains. The trading range of the NIFTY remained just moderately broad, but it oscillated quite a lot, infusing intraday volatility during the trading sessions. While holding on to its key supports, the NIFTY ended with net gains of 130.30 points (+1.17%) on a weekly note. Discounting the intraday volatility that remained ingrained, the India Volatility Index (INDIAVIX) declined modestly by 2.57% to 17.14.
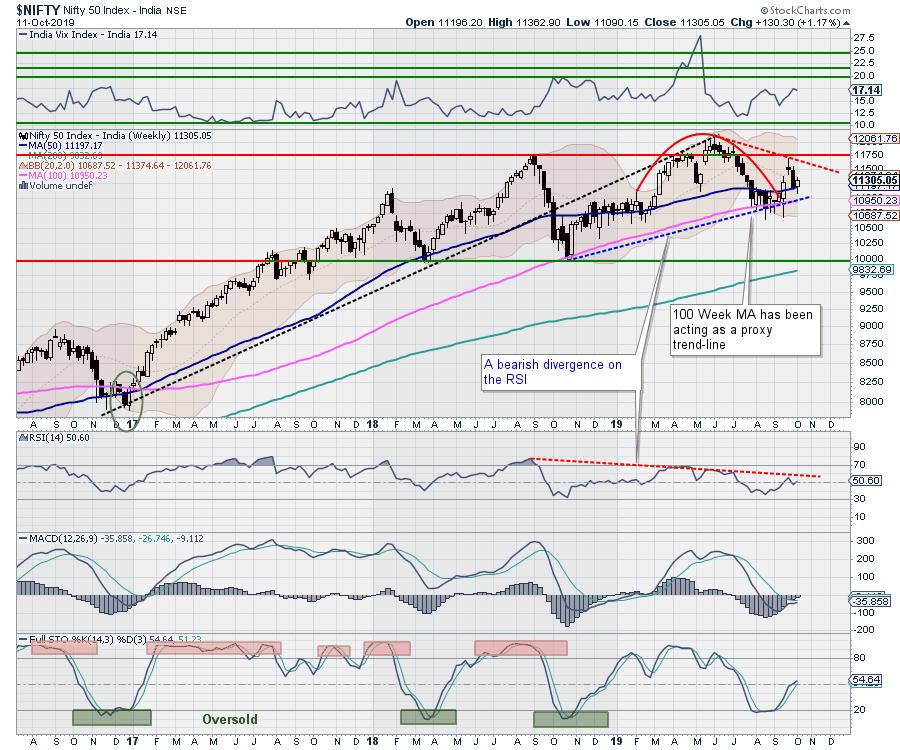
NIFTY has defended two key levels during the previous week: the 200-DMA, which stands at 11270, and the 50-Week MA, which is currently at 11197. The zone of 11197-11270 will act as a crucial support zone over the coming days. Any breach of this zone will invite weakness for the markets. So long as the NIFTY can stay above these levels, we will see some consolidation in a defined range with a limited upside in the markets.
We expect a stable start to the week. The likelihood of a temporary or a partial truce between the U.S. and China may aid the sentiments to some extent. Coming back to technical, the NIFTY continues to remain critically poised, and it will struggle with the weak broader technical setup until it takes out few crucial resistance levels.
The coming week is likely to see the levels of 11375 and 11510 acting as resistance points. The supports will come in at the 11150 and 11000 levels. There are chances of the trading range getting wider again over the coming week.
The Relative Strength Index (RSI) on the weekly chart is 50.5973; it remains neutral and does not show any divergence against the price. The weekly MACD is bearish and continues to trade below its signal line. No significant formations were seen on the candles.
The pattern analysis of the weekly chart reveals a very distinct bearish divergence of the RSI over the long term. Apart from this, the NIFTY has managed to keep its head above the 50-Week MA, which is presently at 11197. Any slip below this level will bring weakness into the markets over the coming days.
The markets are likely to exhibit volatile behavior over the coming days. On the one hand, the broader technical setup remains challenging; on the other hand, NIFTY may keep seeing short covering from lower levels, which will have limited upside potential. The markets are likely to struggle hard to establish a sustainable upward directional bias. We expect the coming week to remain volatile. We reiterate the need to stay light on exposures and vigilantly protect profits at higher levels throughout the coming week.
Sector Analysis for the Coming Week
In our look at Relative Rotation Graphs, we compared various sectors against CNX500 (NIFTY 500 Index), which represents over 95% of the free float market cap of all the stocks listed.
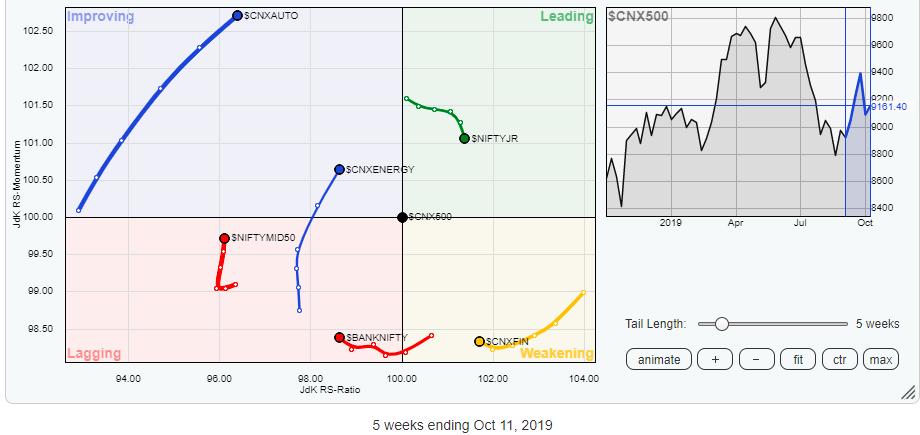
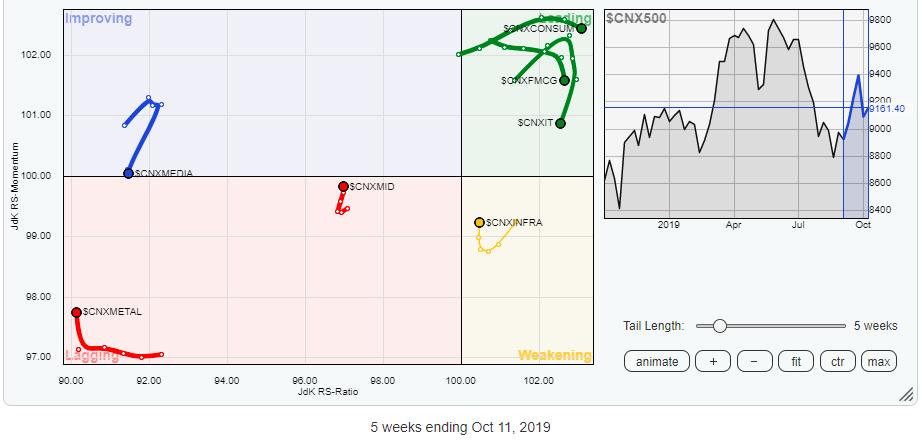
Our review of Relative Rotation Graphs (RRG) shows that the coming week will see buoyant activity in concentrated pockets. Among the FMCG, Consumption and the IT indexes that remain in the leading quadrant, it is only the Consumption pack that has managed to retain its strength. The IT and the FMCG groups are seen losing their relative momentum. We will see only stock-specific activities among these groups.
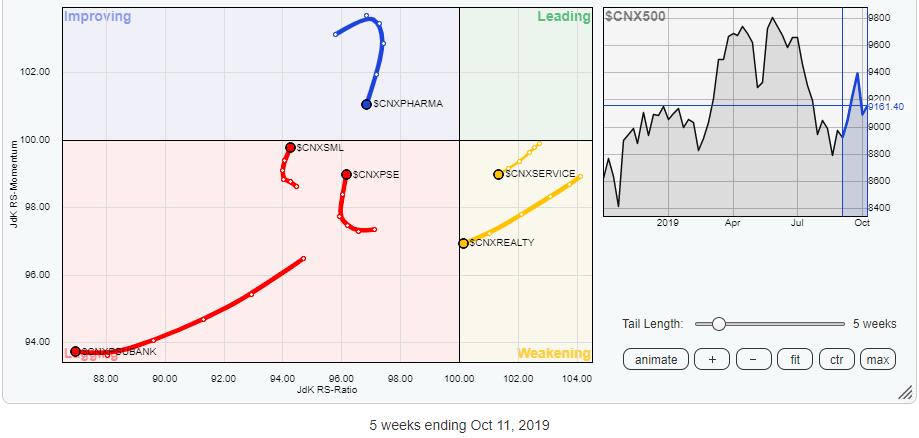
The Auto and the Energy Indexes have firmly advanced into the improving quadrant. They may contribute to relative outperformance against the broader markets, along with the FMCG and Consumption groups. We will see these sectors attempting to post resilient performance over the coming week. The Media and the Pharma groups have sharply lost their relative momentum against the broader markets despite remaining in the improving quadrant and are seen heading southward.
The CPSE index has arrested its decline and is seen consolidating at the moment. Apart from these groups, the Services sector, Realty, Metals, Infrastructure, Financial Services, BankNIFTY and the PSU Banks are likely to be relatively underperforming the broader markets.
Important Note: RRG™ charts show you the relative strength and momentum for a group of stocks. In the above chart, they show relative performance against NIFTY500 Index (Broader Markets) and should not be used directly as buy or sell signals.
Milan Vaishnav, CMT, MSTA
Consulting Technical Analyst,


