The Indian equity markets had a strong week, making a steady upside move and ending the week with decent gains. In the week before this, the NIFTY had defended its crucial support levels of 200-DMA on the daily charts and the 50-Week MA on the weekly charts. After successfully defending these levels, the markets capitalized by inching higher. The benchmark index NIFTY ended with net gains of 356.80 points (+3.16%) on a weekly note.
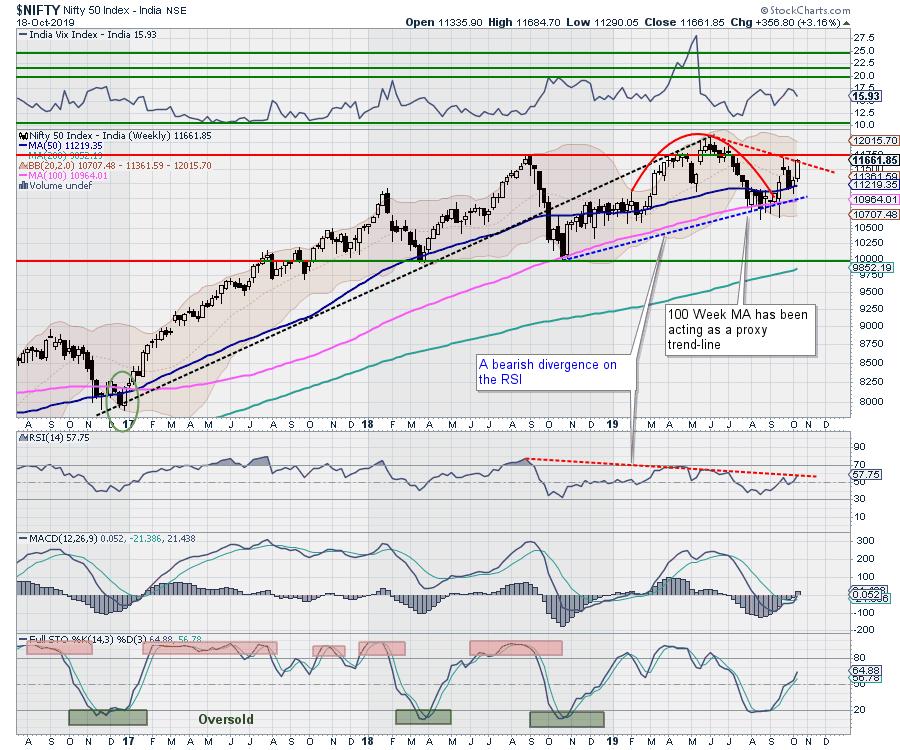
We have a short week ahead of us with Monday being a trading holiday. With the rise throughout the previous week, the NIFTY has again scaled the levels it had fallen below following the corporate tax reforms. The most uncomfortable part of last week's up move was that it has come on back of just short-covering. If NIFTY has to take out the previous high and capitalize on the current move, it needs to be supported with fresh buying.
Though the volatility has steadily declined during the previous week, we expect it to return. The coming week might see a volatile start initially as it adjusts to global trade on Tuesday. That being said, unless we do not see fresh buying coming in, there is the possibility of the current rally getting stalled near the 10700-levels. Though the 50-Week MA, which currently stands at 10964, has become a solid immediate base, it would be very critical to see if the NIFTY gets support from fresh buying to avoid getting fizzled out over the coming days.
The coming week will see the levels of 11700 and 11890 acting as resistance points. Supports are coming in at 11460 and 11300 levels. The weekly RSI is 57.7464; though it has marked a 14-week high in line with the NIFTY, it is seen meeting its pattern resistance. The weekly MACD has shown a positive crossover and now trades above its signal line.
The price behavior of the NIFTY against the 11700-11750 zone will be crucial. Even if the NIFTY inches higher, it would be time to get wary if such an up move is fueled solely by short-covering and not supported by buying. Any up move that is caused only by short-covering without any support from buying tends to get unhealthy at higher levels. Thus, in the rising markets, one may have to chase the momentum, but we recommend doing it with an enormous amount of caution. Failure to move past the 11700-11750 range will, in all likelihood, stall the rally and push the markets into some consolation.
Sector Analysis for the Coming Week
In our look at Relative Rotation Graphs, we compared various sectors against CNX500 (NIFTY 500 Index), which represents over 95% of the free float market cap of all the stocks listed.
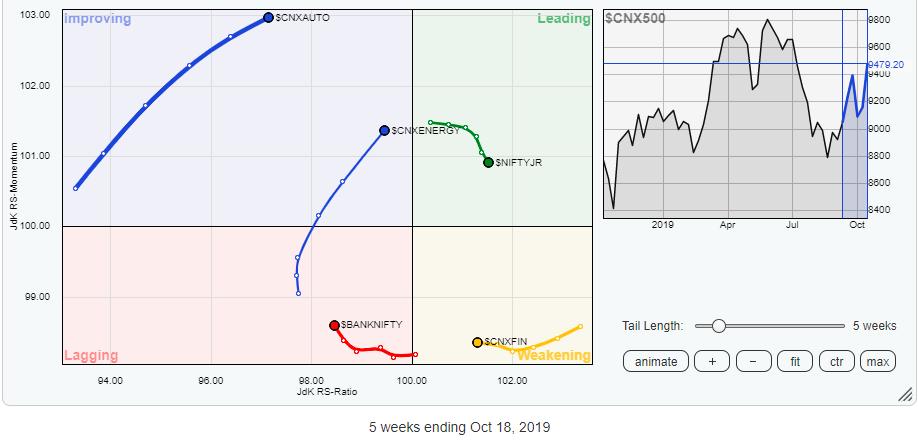
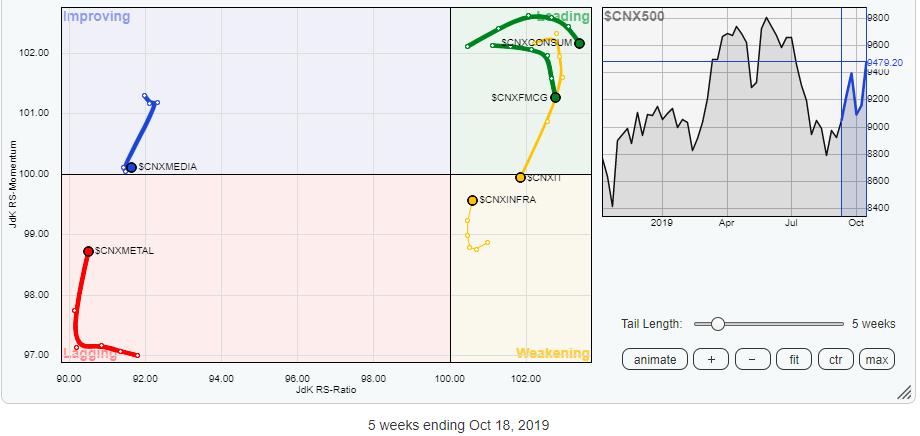
The review of Relative Rotation Graphs (RRG) shows that, while sectors like IT, Financial Services and Services are taking something of a breather, groups like the Auto, Energy, Infrastructure and Metal indexes are building on their momentum while being placed in different quadrants on the RRG. Some sector rotation is evident within these groups.
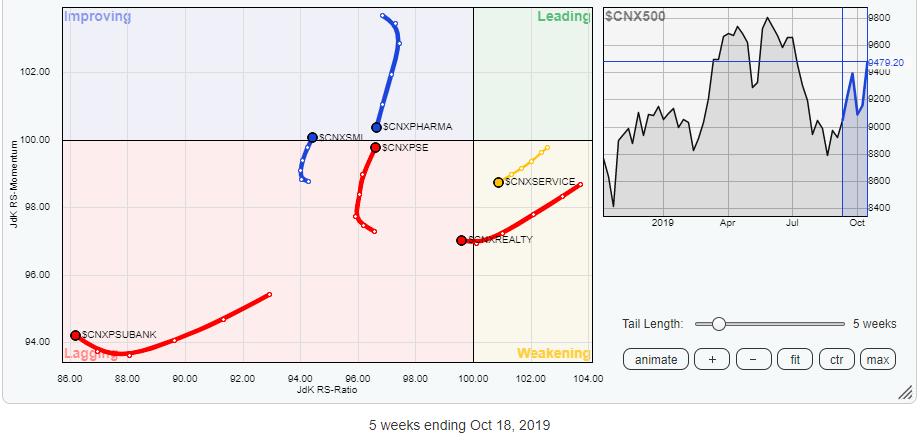
The only two sectors that are placed in the leading quadrant are Consumption and the FMCG index. Although they can be seen taking a breather, but they are likely to relatively continue outperforming the broader markets. The Energy and the Auto groups have firmly advanced while staying in the improving quadrant. They will see stock-specific outperformance over the coming days. The Pharma has taken a U-turn and may soon find itself in the lagging quadrant again if the steady loss of momentum continues.
Important Note: RRG™ charts show you the relative strength and momentum for a group of stocks. In the above chart, they show relative performance against NIFTY500 Index (Broader Markets) and should not be used directly as buy or sell signals.
Milan Vaishnav, CMT, MSTA
Consultant Technical Analyst,


