The previous week played out very much on expected lines. In our last weekly note, we mentioned that NIFTY is facing stiff resistance in the 12000-12100 area and that the bearish divergences are not allowing a clean breakout on the charts. After staying buoyant for a significant part of the week, the markets came under profit-taking from higher levels on Friday. After giving up all its gains gathered over the previous days, the headline index NIFTY ended the week on a flat note, gaining a negligible 17.55 points (+0.15%) on a weekly note.
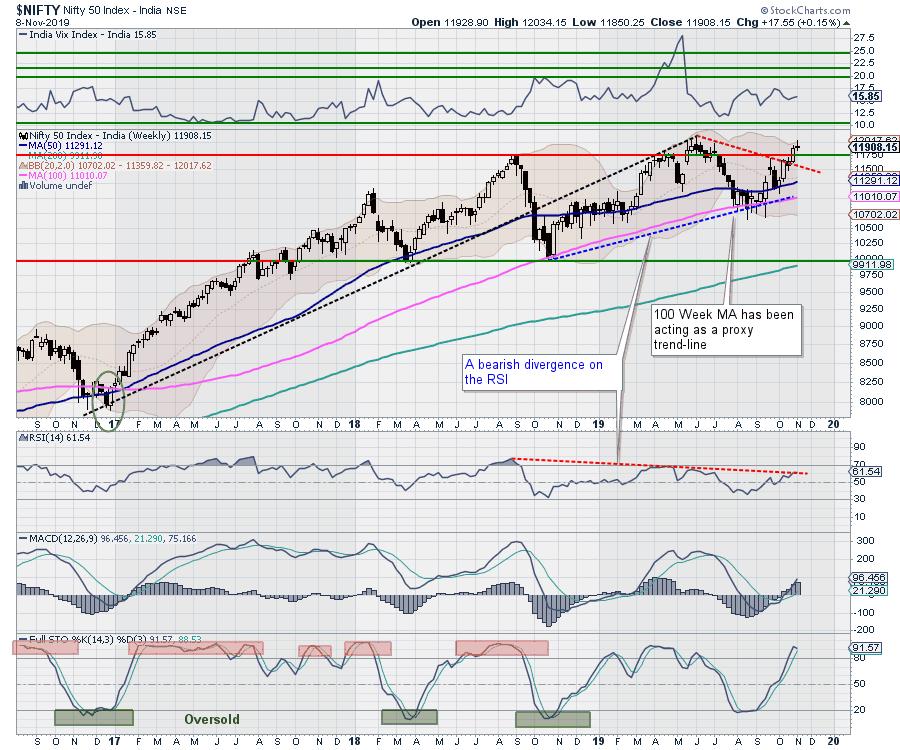
The coming week remains even more crucial than the previous one. The price action has reinforced the zone of 12000-12100 as a stiff resistance zone, with NIFTY failing to break above it and coming under profit-taking from those levels. The bearish divergence against the price action continues to appear on the RSI. Unless the bearish divergence does not get corrected, it will either prevent a breakout or keep the breakout devoid of potency, leaving it vulnerable at higher levels.
We have a truncated week ahead with Tuesday being a trading holiday on account of Nanak Jayanti. The levels of 12030 and 12150 are expected to act as resistance, while supports are expected to come in lower at 11850 and 11700. In the event of any downside, the range is expected to get wider.
The weekly RSI stands at 61.54; it remains neutral, but continues to show bearish divergence against the price as it appears to be making lower tops. The weekly MACD continues to be bullish and remains above its signal line.
On candles, a classic Shooting Star has emerged. For a candle to qualify as a shooting star, the upper shadow should be long enough to be at least double the size of its real body. A shooting star appears when the price opens high and gets stronger, but comes off its high to close near its open price on either side.
The pattern analysis of the weekly charts clearly shows the loss of momentum for the markets. After breaking down from the 30-month long upward rising channel in October 2018, the NIFTY has created multiple resistance points in the area between the 12000-12100 levels. While it made incremental highs after October 2018, it has encountered a bearish divergence from the lead indicators.
When the previous week had started, it was a fingers-crossed-situation, as the NIFTY could have attempted a breakout with or without confirmation from other indicators. However, with the previous coming to a close, the overhead resistance in the area between 12000-12100 has become stronger, with a Shooting Star punctuating a rally.
For the NIFTY to have a sustainable breakout above the 12000-12100 area, the bearish divergence needs to get corrected first. If the breakout occurs without this condition getting corrected, it will raise direct question marks on the sustainability and health of the rally. We recommend treading the markets with caution and not attempting to make aggressive purchases on the decline. Approach the markets with a high degree of caution and stock-specific mindset.
Sector Analysis for the Coming Week
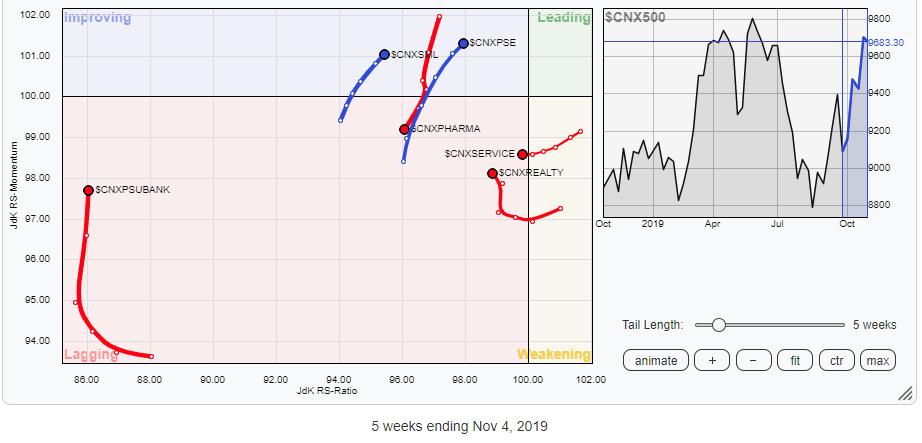
In our look at Relative Rotation Graphs, we compared various sectors against CNX500 (NIFTY 500 Index), which represents over 95% of the free float market cap of all the stocks listed.
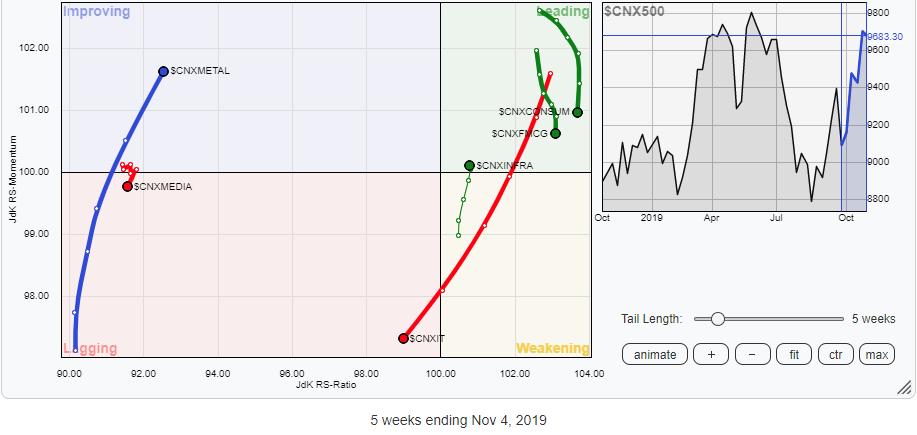
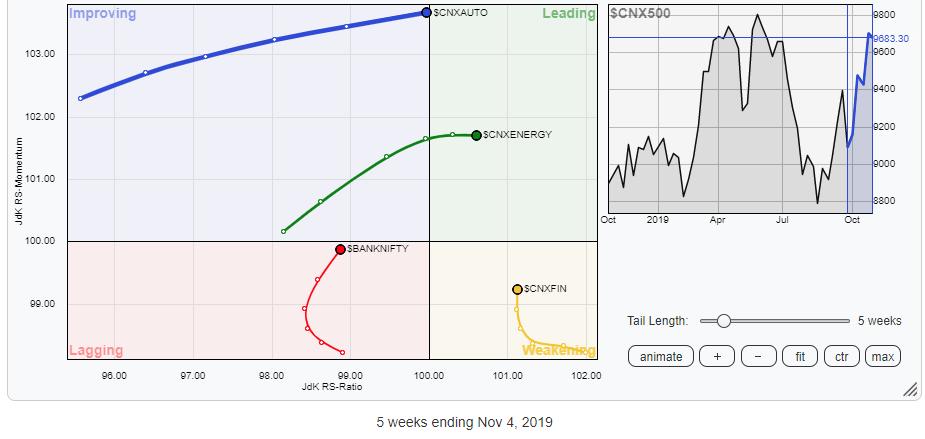
Our review of Relative Rotation Graphs (RRG) shows that the FMCG, Consumption, Infrastructure and Energy groups remain in the leading quadrant. Among these, while Energy and Infrastructure and building further on their relative momentum, the FMCG and Consumption groups appear to be in the process of topping out. Though cumulative out-performance may be expected from these groups, more should come from the Energy and Infrastructure over the coming week.
The small-caps, PSE, Auto and Metal groups are seen firmly advancing in the improving quadrant. BankNIFTY, too, is in the process of bottoming out and ending its recent underperformance. The Financial services pack is showing some resilient performance as well.
The PSU Bank sector is trying hard to bottom out, though it has some distance to cover yet. The IT sector, along with Realty, Services, and Pharma, are in the lagging quadrant while grossly underperforming the broader markets.
Important Note: RRG™ charts show you the relative strength and momentum for a group of stocks. In the above chart, they show relative performance against NIFTY500 Index (Broader Markets) and should not be used directly as buy or sell signals.
Milan Vaishnav, CMT, MSTA
Consulting Technical Analyst,


