The week that went by continued to trade on the expected lines, while the 12000-12050 zone continued to pose resistance to the markets on the upside. The week was spent with the markets consolidating at higher levels while demonstrating weakness near the critical resistance zone. The NIFTY headed nowhere over the past couple of days, then formed a lower top and lower bottom on the weekly bar charts. After oscillating back and forth in a defined range, the NIFTY ended flat with a negligible loss of 12.70 points (-0.11%) on a weekly basis.
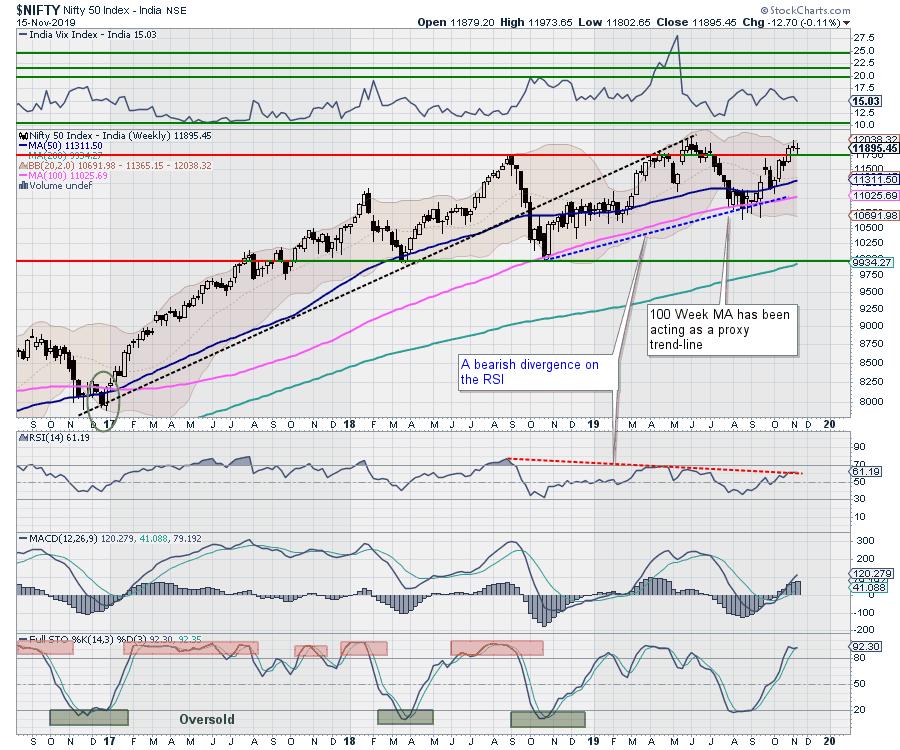
The coming week will have a few crucial technical points to be watched. Though the NIFTY looks healthy, the up move throws a few concerns as the bearish divergence continues to persist and is yet to be resolved. Also, the NIFTY continues to find strong resistance in the 12000-12050 area while exhibiting signs of exhaustion near this zone. The volatility index INDIA VIX has settled down near the lower range and is presently at 15.03, down 5.20% over the previous week.
The coming week is likely to see a flat start to the trade and may even show a few more attempts to move higher. However, the levels of 12050 and 12150 will act as strong resistance, while supports will come in lower at 11750 and 11650. In the event of any corrective move, the trading range for the coming week is likely to remain wider than usual.
The weekly RSI stands at 61.50; it remains within a formation and shows bearish divergence against the price. While the NIFTY is not marking any lower highs, the RSI is seen making lower tops. This formation needs to be resolved for any sustainable up move going ahead. The weekly MACD is bullish as it trades above its signal line.
In the previous week, a classic Shooting Star had emerged. It was a perfect shooting star, with the upper shadow long enough to be nearly double the size of its real body. In the week that went by, this shooting star was followed by the formation of a Doji candle, showing exhaustion at higher levels and increasing the possibility of the markets taking a breather at current levels.
Going by the pattern analysis, it is evident that the NIFTY is presently in good shape and has made incremental highs over the past couple of months. However, the strength in the move is missing and bearish divergence is observed on the RSI, which is a leading indicator. The RSI is making lower tops and remains trapped in a formation.
A sustainable up move will occur only if the NIFTY moves past the 12000-12050 area convincingly. Adding to this, in order to make any up move sustainable at higher levels, the bearish divergence on the RSI also needs to be corrected. Unless these conditions are satisfied, the markets will continue to find stiff overhead resistance and will stay vulnerable to profit-taking at higher levels. In the event of any corrective move, the volatility is likely to increase. We recommend continuing to follow the uptrend (if there is any) prudently and cautiously while protecting profits at higher levels.
Sector Analysis for the Coming Week
In our look at Relative Rotation Graphs, we compared various sectors against CNX500 (NIFTY 500 Index), which represents over 95% of the free float market cap of all the stocks listed.
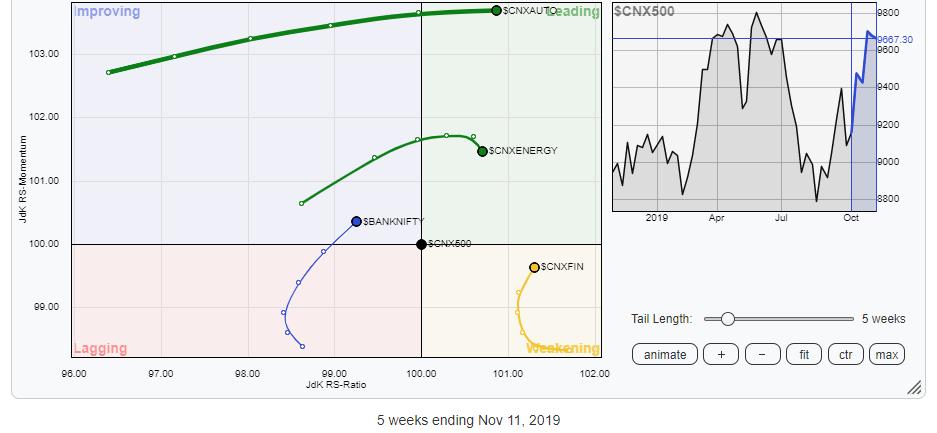
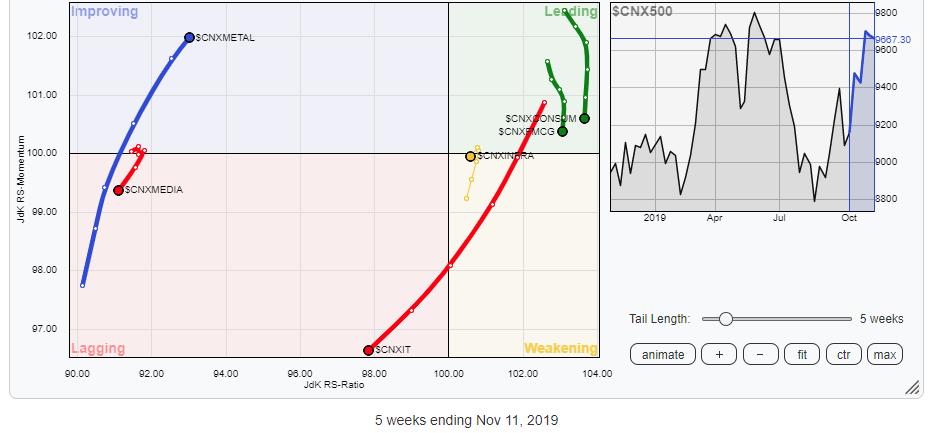
The review of Relative Rotation Graphs (RRG) shows that the coming week is likely to see relative out-performance from the Auto Index, as it has strongly crawled into the leading quadrant while maintaining its momentum. Along with the Auto index, the Energy pack is also placed in the leading quadrant though mildly faltering on its momentum. The FMCG and the Consumption indexes are also in the leading quadrant; looking at the sharpness of its loss of momentum, they appear to be in the process of topping out.
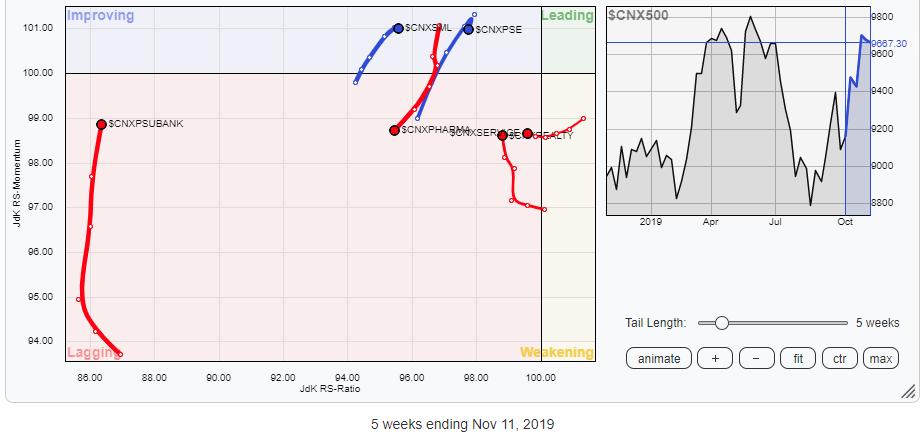
BankNIFTY, while sharply improving on its momentum, crawled into the improving quadrant; this shows likely resilience against any significant downsides going forward and some relative outperformance against the broader markets. Financial services, Metal, PSU Banks, and the Realty groups appear to be making attempts to stabilize themselves going ahead. Isolated and stock-specific outperformance cannot be ruled out from these groups.
Apart from this, the Pharma, Media and IT groups, when benchmarked against the broader markets, may end up with relative under-performance.
Important Note: RRG™ charts show you the relative strength and momentum for a group of stocks. In the above chart, they show relative performance against NIFTY500 Index (Broader Markets) and should not be used directly as buy or sell signals.
Milan Vaishnav, CMT, MSTA
Consulting Technical Analyst,


