The risk-on global setup, which had begun a week before, continued throughout the past week as well. The resultant buoyant setup fueled the Indian markets higher as well, which ended at their high lifetime levels. Though the momentum continued to falter, the markets did not show any sign of retracement and instead continued to consolidate at higher levels. After experiencing range-bound moves over the past couple of days, the benchmark index NIFTY ended the week with a net gain of 185.10 points (1.53%).
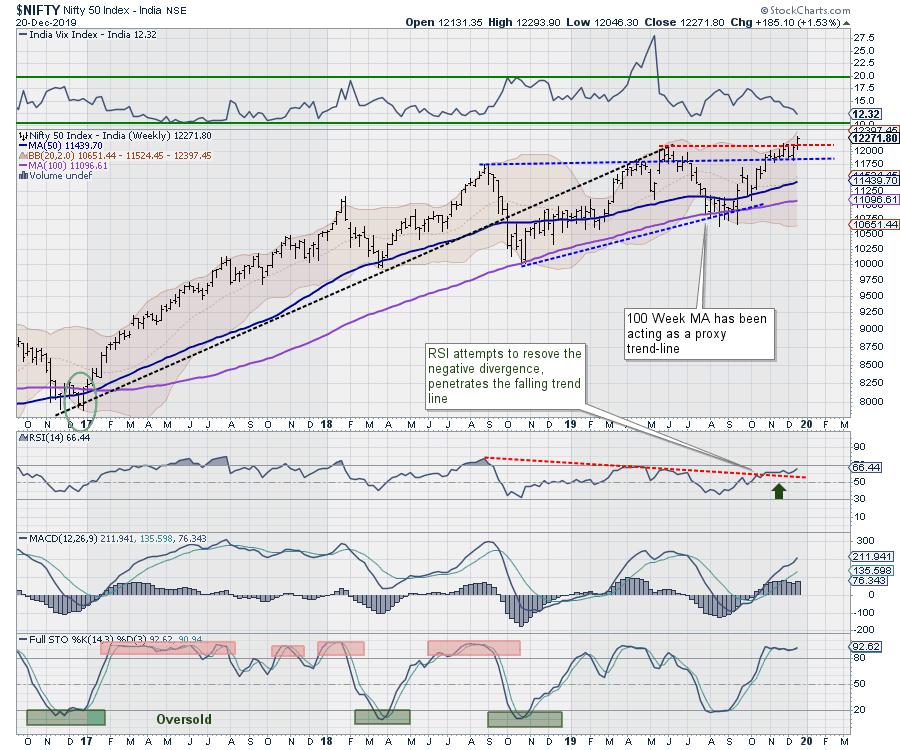
While we trade at near lifetime highs, there are a couple of points we should not ignore. Despite the NIFTY closing at its highs, the loss of momentum is very much visible on the charts, which has resulted in a weakening market breadth. The India Volatility Index – INDIAVIX – has cooled off further by 7.33% to 12.32, trading to one of its lowest levels over the recent months. All these may not result in any immediate downtrend, but it is something that we should keep in mind and have situational awareness of as we follow the trend.
The coming week is expected to have a quiet start to trading. The NIFTY continues to remain in uncharted territory; the level of 12310 and 12400 will act as resistance, and supports will come in much lower at 12170 and 11900 levels. In the event of any corrective move, the trading range is expected to get broader than usual.
The Relative Strength Index (RSI) on the weekly chart is 66.44; it stays neutral and does not show any divergence against the price. The weekly MACD is bullish, and it trades above its signal line. The PPO remains positive. A white body has emerged on the candles, though it does not represent any critical formation on the charts.
The pattern analysis of the weekly charts shows that the NIFTY has achieved a breakout after moving past 12100 on a closing basis. There is evident loss of momentum on the charts, but, so long as the NIFTY stays above 12100, this breakout will continue to remain in force.
If we see continued uptrend over the coming week, we will need to keep in mind that the markets remain somewhat overbought and overextended on the charts. Such a formation has increased the possibility of the market taking a breather; it does seem due for some consolidation at current levels. We reiterate the need to exercise prudence and resort to vigilant protection of profits at higher levels to avoid getting caught on a wrong foot in the event of any corrective moves, if there are any. A cautious following of the uptrend is advised.
Sector Analysis for the Coming Week
In our look at Relative Rotation Graphs®, we compared various sectors against CNX500 (NIFTY 500 Index), which represents over 95% of the free float market cap of all the stocks listed.
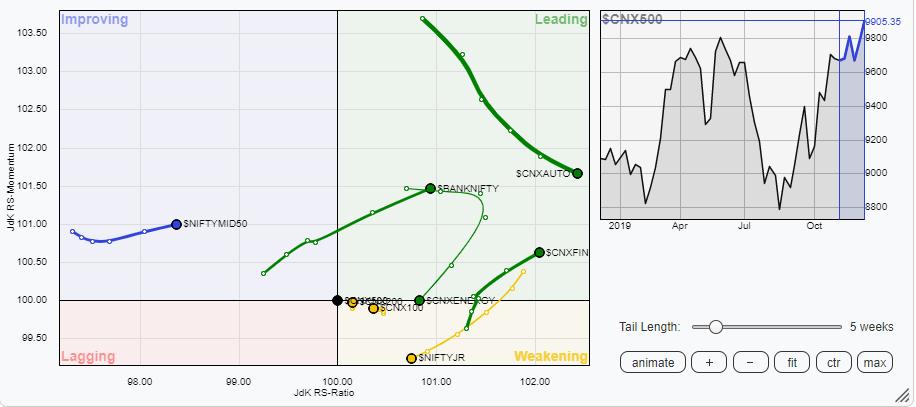
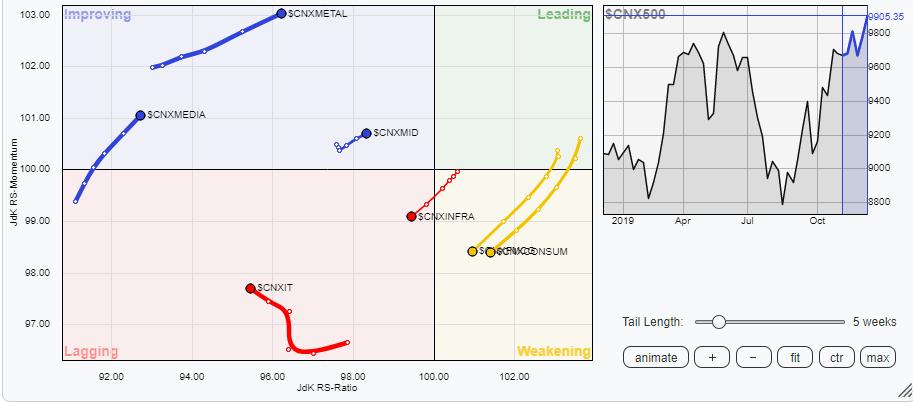
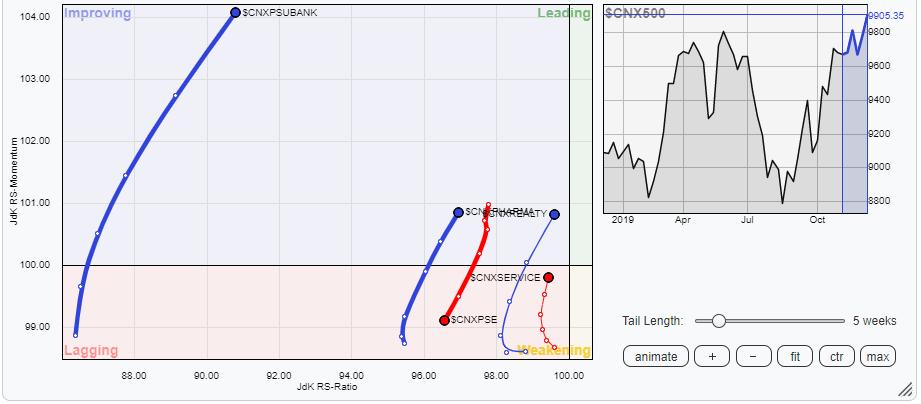
The review of Relative Rotation Graphs (RRG) shows that, for the coming week, we will need to keep our focus on PSU Banks, BankNIFTY, Media, Metal, Pharma and Auto Stocks. These sectors are placed at different places in the Improving and the Leading Quadrant and appear to be moving higher while maintaining their relative momentum. These groups may collectively present relative outperformance when benchmarked against the broader NIFTY 500 Index. The degree of their relative outperformance will vary because of their distance from the benchmark NIFTY 500 Index.
The Energy group is on the verge of slipping into the weakening quadrant. Alongside the Energy index, the FMCG and the Consumption indexes have also advanced further in the weakening quadrant. The Infrastructure index has further advanced in the lagging quadrant; these groups are likely to relatively underperform the broader markets.
The IT pack remains the worst performer; it is seen lying far in the lagging quadrant while attempting to stabilize. However, it is unlikely to show any significant performance over the coming week. The Financial services pack has also advanced in the leading quadrant and is likely to display some resilience in the event of any corrective move in the markets.
Important Note: RRG™ charts show the relative strength and momentum for a group of stocks. In the above chart, they show relative performance against NIFTY500 Index (Broader Markets) and should not be used directly as buy or sell signals.
Milan Vaishnav, CMT, MSTA
Consulting Technical Analyst,


