As the Indian markets traded on the anticipated lines, they continued to consolidate, but also saw tremendous volatility owing to the geopolitical tension in the West Asian region. The NIFTY traded in a wider-than-usual range and ended the week on a relatively flat note. The index witnessed close to 400 points of movement on either side, ultimately closing with weekly gains of 30.15% (0.25%).
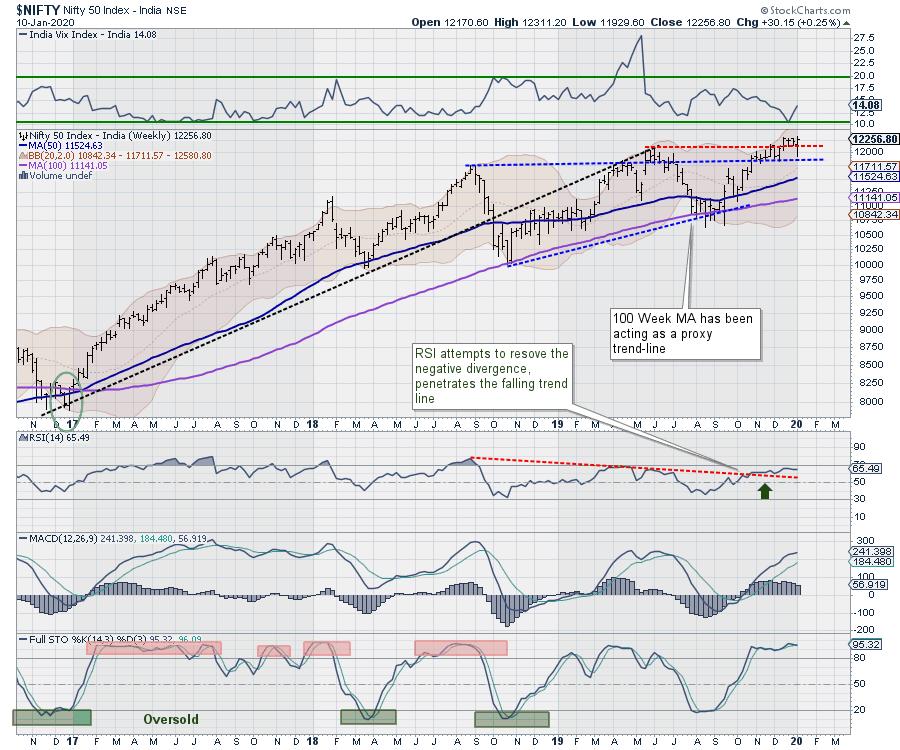
Just like the previous week, we may see some geopolitical tensions continue to hunt the markets, but the news flows are unlikely to be as intense as the last week. Returning to the technical, loss of momentum is resurfacing again and remains quite evident on the charts. The Indian Volatility Index (INDIAVIX) rose again by 10.89% during the week to 14.08. Over the past couple of days, the INDIAVIX has gained over 45% from its recent lows. The F&O data continues to show upsides, remaining capped in the immediate short-term.
The markets are likely to see a soft start to the week. The levels of 12330 and 12400 will continue to act as strong overhead resistance for the markets. The supports come in lower at 11990 and 11910. Any move on the downside is likely to be accompanied by increased volatility as well.
The Relative Strength Index (RSI) is 65.49 on the weekly charts; it remains neutral and does not show any divergence against the price. The weekly MACD is bullish; it trades above its signal line.
On the candles, a Hanging Man pattern has emerged. Though the current pattern is not a classic Hanging Man Patter, as it has a small upper shadow, it may potentially stall the present up move. This will require confirmation on the next bar on the charts.
The pattern analysis of the weekly charts shows that the NIFTY has not made any incremental high on the closing basis. Also, it remains slightly overstretched on the charts as the Stochastic is still highly overbought. The lack of internal strength is also visible, as RSI is not moving higher with the usually accompanied strength.
The past week was the fourth week in a row where the NIFTY has halted its advance near the current levels. The price action of NIFTY against the levels of 12300-12350 continues to remain crucial for the coming week as well. Unless these levels are not taken out comprehensively, the NIFTY is unlikely to have any sustainable up move over the coming days. Since the markets are likely to remain vulnerable at higher levels, we reiterate that it would be prudent to avoid excessive leverage and continue protecting profits at higher levels.
Sector Analysis for the Coming Week
In our look at Relative Rotation Graphs®, we compared various sectors against CNX500 (NIFTY 500 Index), which represents over 95% of the free float market cap of all the stocks listed.
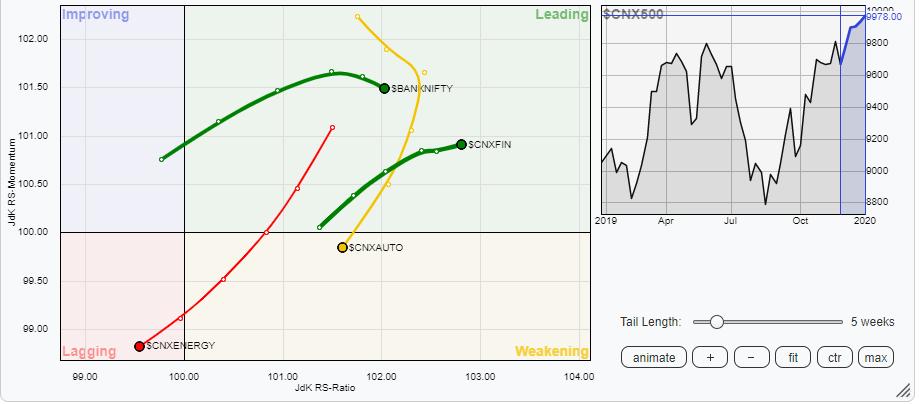
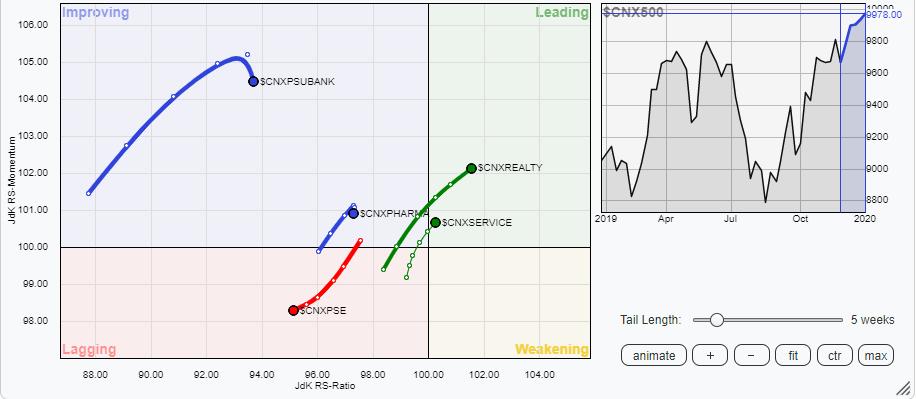
The review of Relative Rotation Graphs (RRG) shows that the financial groups are expected to outperform the broader NIFTY500 Index relatively. The BankNIFTY and the Financial Services index remain in the leading quadrant and, along with these two groups, the Realty and the Services Sector groups also remain in the leading quadrant.
Besides this, the PSU Banks, Pharma and the Media packs have shown a sudden loss of momentum midway. If this trend continues, we will see the rotation of these sectors being damaged abruptly; some underperformance may creep into these groups.
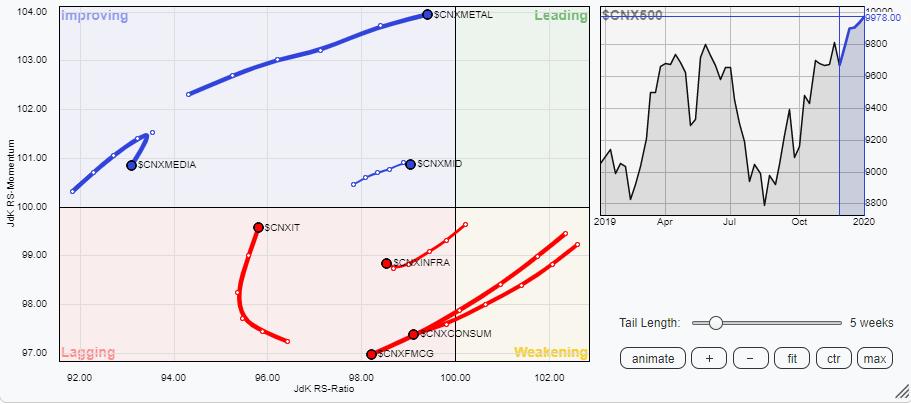
Apart from this, the PSE, Infrastructure, Consumption, FMCG and Energy indexes are drifting further into the lagging quadrant and are likely to underperform the broader NIFTY500 index relatively.
The Auto Index has slipped into the weakening quadrant; it appears to have topped out. On the other hand, the IT pack is seen improving on its relative momentum while remaining in the lagging quadrant; it appears to be in the process of bottoming out.
Important Note: RRG™ charts show the relative strength and momentum for a group of stocks. In the above chart, they show relative performance against NIFTY500 Index (Broader Markets) and should not be used directly as buy or sell signals.
Milan Vaishnav, CMT, MSTA
Consulting Technical Analyst,


