The headline index NIFTY is presently trading near its lifetime-high levels, returning a stellar 15% over the past 12 months and 1.08% on a Year-to-Date basis. Having said this, the loss of momentum and few negative divergences on the leading indicators are quite evident on the charts. It will not be a surprise if the NIFTY takes a breather by correcting modestly or consolidating in a well-defined range.
On the technical landscape, a few important changes are taking place that warrant our attention. These three charts tell a story worth a million words!
The whole of 2018 and 2019 has been a period of concentrated gains for the Indian Markets. The gains have been driven by front-line stocks as the Relative Strength of the mid-caps and the small-caps was under a secular decline. However, things seem to be changing now.
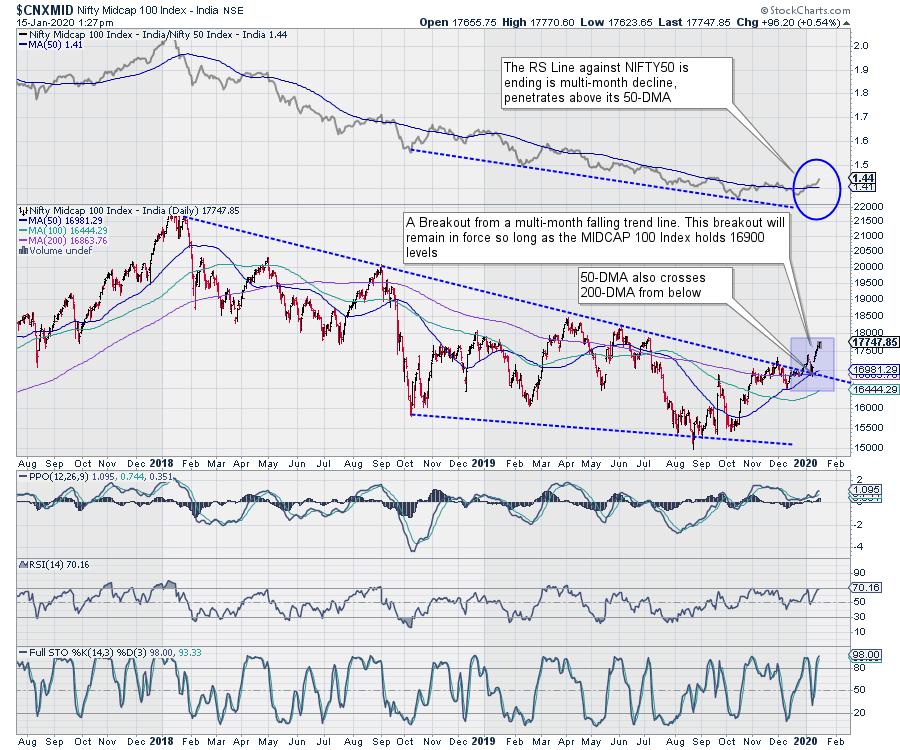
The above is a Weekly NIFTY Midcap 100 Index ($CNXMID). The Midcap Index showed a clear breakout as it moved past its 24-month long falling trend line. It can be seen ending its multi-year down trend as the RS Line, when compared against NIFTY50, appears to be reversing its trend. The RS Line has turned higher and penetrated its 50-DMA, which had been acting as its proxy trend line for nearly 2 years. To add to this, the 50-DMA has crossed 200-DMA from below, resulting in a Golden Cross.
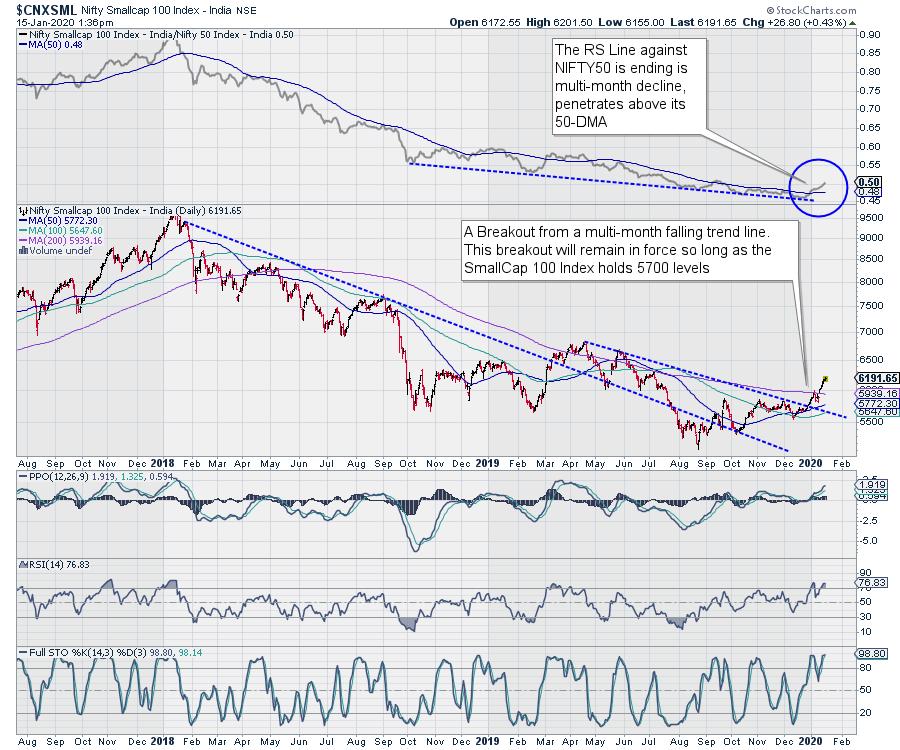
A similar picture is apparent on the Smallcap Index ($CXNSML) Chart. The Smallcap 100 Index has shown a clear breakout as it moved past its 24-month long falling trend line. It can be seen ending its multi-year down trend as the RS Line, when compared against NIFTY50, appears to be reversing its trend. The RS Line has turned higher and penetrated its 50-DMA, which had been acting as its proxy trend line for nearly 2 years.
The Relative Rotation Graph (RRG) also paints an interesting picture:
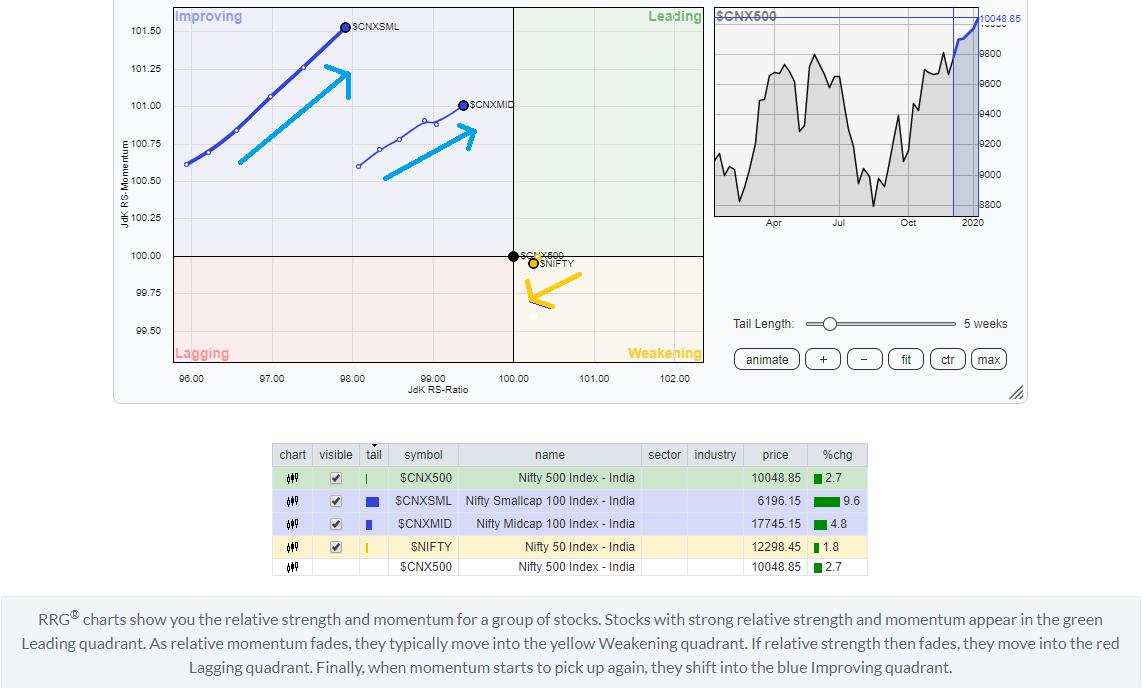
The chart above has the NIFTY MidCap 100 Index, NIFTY Small Cap Index and the NIFTY 50 plotted; they are benchmarked against the broader NIFTY500 Index ($CNX500). The NIFTY500 Index is also plotted, but it is just there to highlight the center point and it has no other relevance.
It is evident that the NIFTY50 is very near the benchmark. Anything that is near to the centerpoint, i.e. the benchmark, will have a lesser amount of alpha capture potential. Also, the NIFTY50 is seen slipping into the lagging quadrant and has shown signs of topping out.
On the other hand, the NIFTY Midcap 100 and Smallcap 100 index are seen building on their momentum and are firmly placed in the improving quadrant. This is the evidence of the fact that their bottoming-out process is completed and has also resulted in to a breakout on the charts above. Importantly, they are far away from the centerpoint, i.e. the NIFTY 500 Index, which is the benchmark. The mid-cap and the small-cap indexes are not just likely to relatively outperform the broader markets, they are also likely to offer much alpha capture possibilities than the frontline index.
There is the possibility that there may some overall corrective moves in the markets, but it is beyond doubt that the mid- and small-cap indexes will relatively outperform the broader markets.
This reading will remain valid so long as the MidCap 100 index stays above 16900 and the Small Cap Index stays above 5700.
Milan Vaishnav, CMT, MSTA
Consulting Technical Analyst,


