As 2019 ended, we saw the markets ending near the high point of the year. Despite the negative ending on the last trading day of the year, the front-line NIFTY50 has ended the year with strong gains of 11.53% on an annual note. However, that being said, the year has also left us with so much to read on the long-term charts and has offered many clues that suggest that the year 2020 may remain that of capped gains.
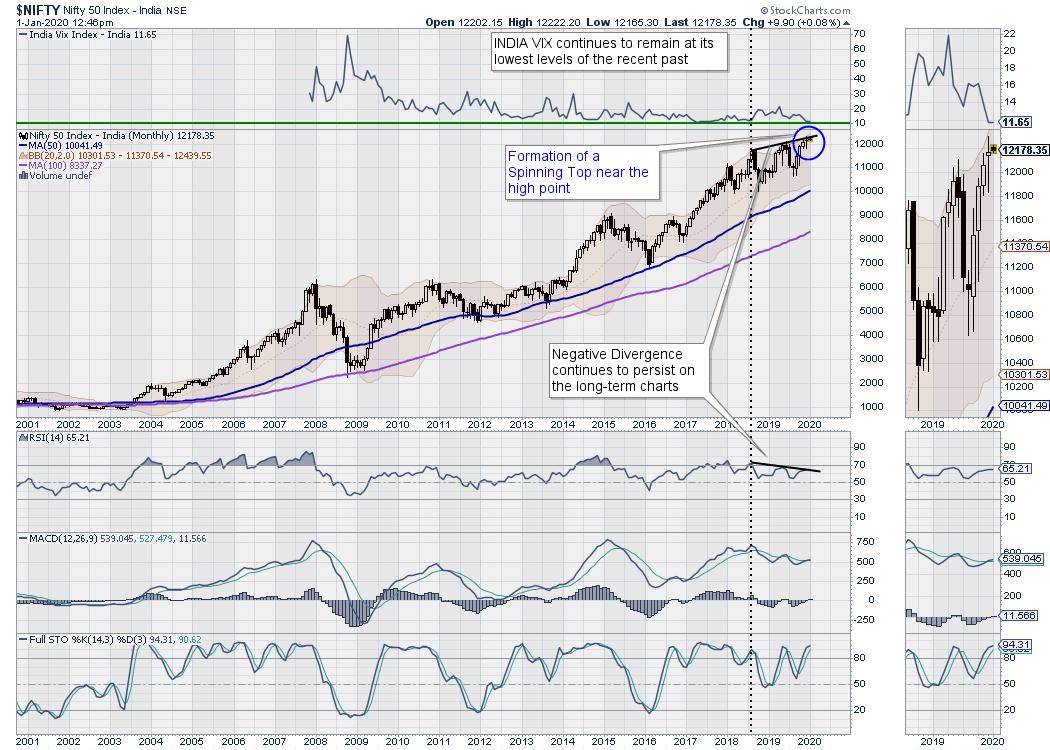
The above is the long-term 20-year monthly chart of the NIFTY50 index. As evident from the beginning of 2018 and all through 2019, the NIFTY has marked incremental highs. However, the incremental highs on the frontline index have come with a continued Bearish Divergence on the RSI. The bearish divergence has occurred as the NIFTY marked higher levels, while the RSI did not remain in sync and made lower tops instead. This pattern is yet to be resolved.
Additionally, despite the 11.53% of gains in the NIFTY, this gain has also remained primarily limited by the contribution of just five stocks. Reliance, ICICI Bank, HDFC, HDFC Bank, and Kotak bank has counted for over 85% of the total gains of NIFTY.
Another vital thing to note from the technical perspective is that, over the last two years, there has been less and less contribution from the broader markets while the front line index gained.
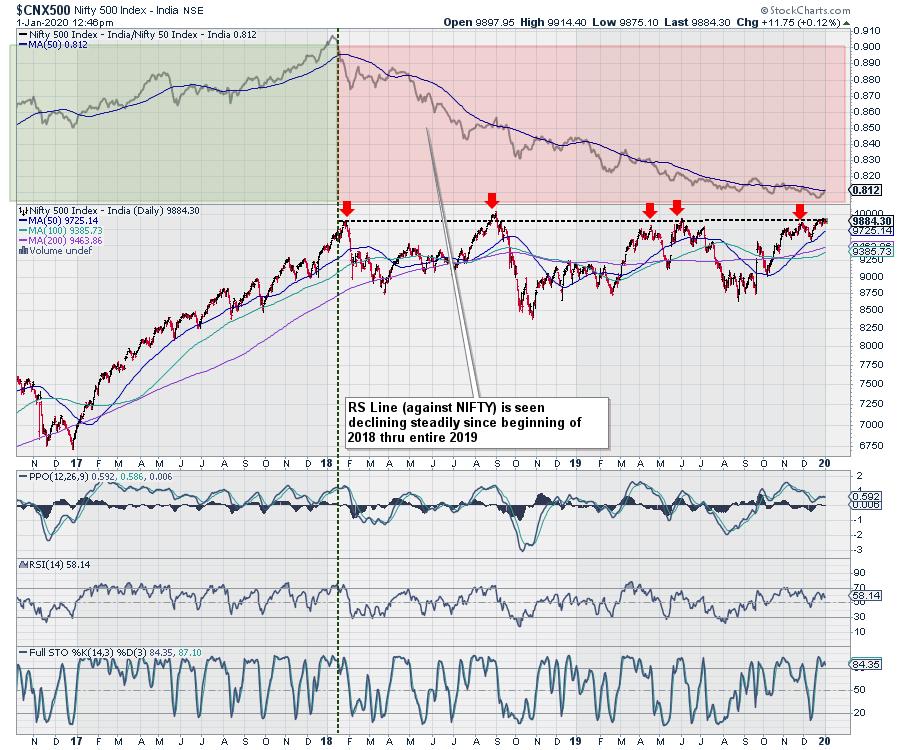
The NIFTY500 Index represents the broader market, which is over 95% of the total free-float market cap. As seen in the above chart, while it hit its high, the rise in the markets was secular. The secular participation was reflected through the RS Line, which compares the performance of the NIFTY500 index against the NIFTY50. The rising nature of this line up until 2018 shows that the broader markets performed far better than the NIFTY50 and the gains we secular in nature.
However, since the beginning of 2018 and throughout 2019, whenever the NIFTY500 revisited its peak, the RS Line, which compares the NIFTY500 index with the NIFTY50, has remained under secular decline. This shows that there has been lesser and lesser participation of the broader markets; while it was only the NIFTY50 that gained, that, too, driven by gains of just five stocks.
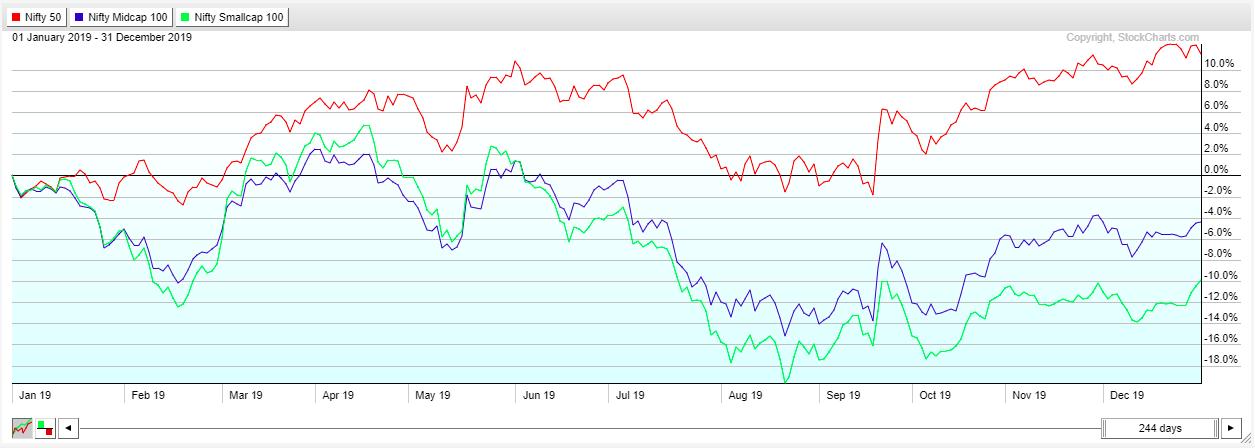
Even during 2019, while the NIFTY 50 gained 11.53%, the MidCap Index lost 4.42%. The Small Cap Index also lost 9.91%.
The monthly charts of the NIFTY continue to show bearish divergence; this pattern is not yet resolved. Also, the occurrence of the Spinning Top on the candles points towards likely exhaustion of the up move. Making matters difficult is that the broader market breadth also continues to stay dismal; the absence of participation in the up move from the broader markets is a definite cause for concern going ahead.
To make a conclusion from the present technical setup, the NIFTY needs to resolve the current negative divergence against the lead indicators. In addition, if the broader markets fail to perform, it may not be surprising if the year 2020 turns out to be a year with capped upsides.
Milan Vaishnav, CMT, MSTA
Consulting Technical Analyst,


