After starting the week on a corrective note, the market recouped some of its losses on the last two trading days of the week. The last few days have remained volatile for the markets as the headline index NIFTY traded in a wider-than-usual range. The index oscillated in an over-340-point range, but did not show any clear breakout and remained away from all-time high levels. After a volatile week, the headline index NIFTY ended with a net loss of 104.10 points (-0.84%).
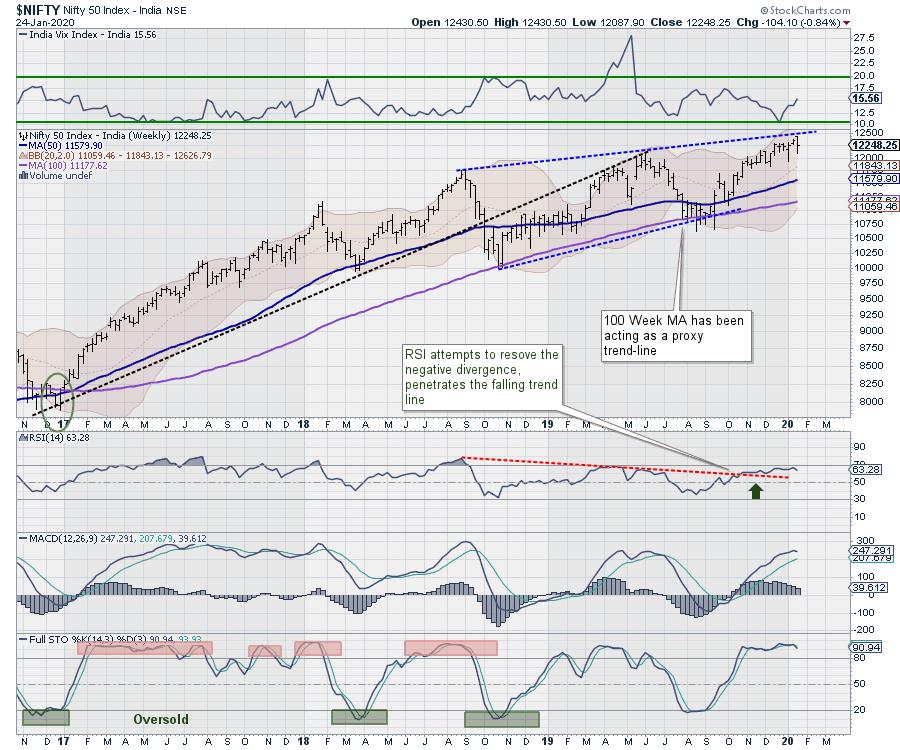
Taking a look at the broader technical structure, the NIFTY has not moved past the pattern resistance that exists in the form of a rising trend line. The volatility index (INDIAVIX) also rose 10.14% to 15.56 after remaining flat during the week before this week. Looking at the weekly charts and reading them alongside the shorter-term timeframe charts, it appears that the NIFTY has put an intermediate top in place. The levels of 12430 will be crucial to watch and, with the next week being expiry week, we will see the remaining days dominated with rollover-centric activities.
Over the past two sessions, the up move has come with a net reduction in the OI, which indicates short-covering from the lower levels. The coming week is likely to see a tentative start to the trade. The levels of 12410 and 12460 will act as resistance, while supports will come in lower at the 12100 and 12000 levels. In the event of any corrective activity in the markets, the trading range is expected to get broader than usual.
The Relative Strength Index (RSI) on the weekly chart stands at 63.28; it remains neutral and does not show any divergence against the price. The weekly MACD remains bullish and trades above its signal line. The slope of the histograms appears to be declining, which shows gradual loss of momentum on the weekly charts. An engulfing bearish candle has appeared. Such a formation should be ignored, as it has appeared at the high point and may potentially stall the up move. However, a confirmation will be required in the next bar.
The pattern analysis of the weekly chart shows that, despite the incremental high formed on the charts, the NIFTY has not penetrated the pattern resistance that exists in the form of a rising trend line. NIFTY will have to penetrate the referred pattern resistance comprehensively for a sustainable upward breakout.
Despite marking incremental highs during the week, the NIFTY has not penetrated the pattern resistance in the form of the rising trend line. Unless this happens, we are unlikely to see any significant breakout in the coming week. The markets will stay vulnerable at higher levels, and volatility is likely to increase further given the forthcoming expiry of the current derivative series. It is strongly advised against creating excessive exposures unless a breakout is achieved and the markets see through the Union Budget. While avoiding leveraged positions, all up moves (if any) should be utilized to protect profits at higher levels.
Sector Analysis for the Coming Week
In our look at Relative Rotation Graphs®, we compared various sectors against CNX500 (NIFTY 500 Index), which represents over 95% of the free float market cap of all the stocks listed.
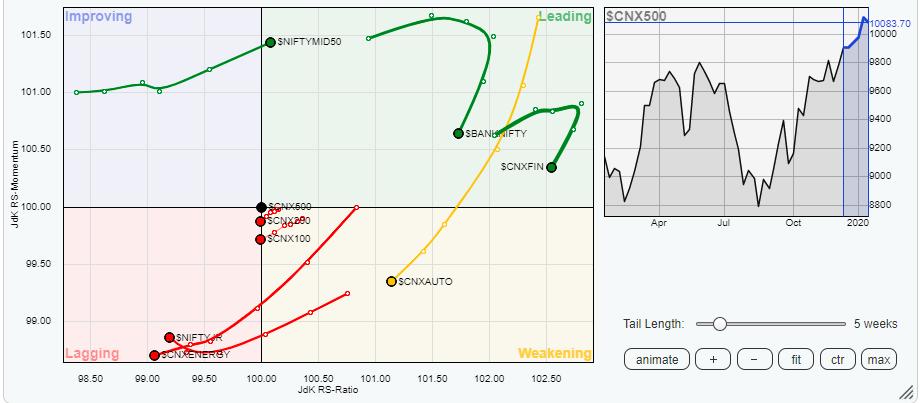
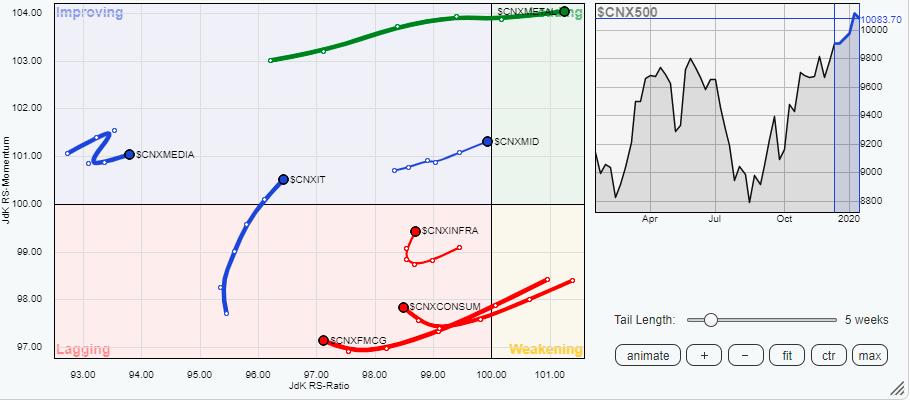
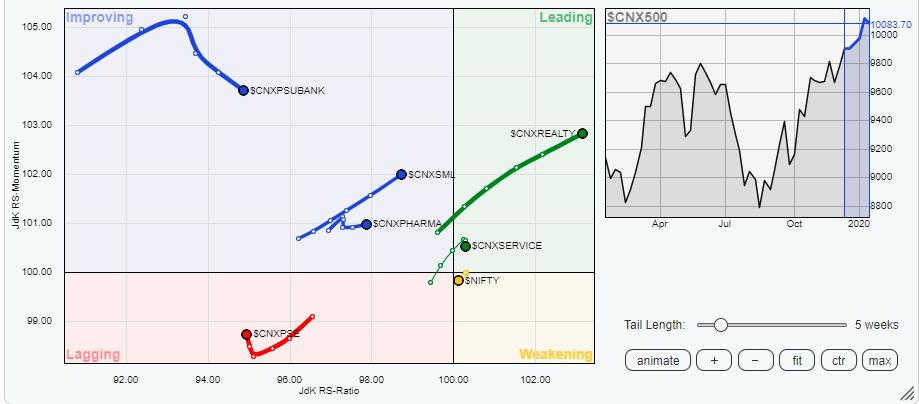
The review of Relative Rotation Graphs (RRG) shows that the sector rotation has continued on the expected lines. The Metal and the Realty indexes have continued to advance while staying placed firmly in the leading quadrant. Just like the previous week, the BankNIFTY and the Financial Services index appear to be steadily losing their relative momentum. This means that, while they may be doing well individually, other pockets are performing better, relatively speaking.
The NIFTY Auto Index has slipped further in the weakening quadrant. The FMCG, Consumption and Energy packs are seen moving and rotating in the lagging quadrant. These groups are likely to underperform the broader markets on relative basis.
The Infrastructure index remains in the lagging quadrant, but appears to be attempting to arrest its underperformance and improve on its relative momentum. However, it is yet to complete its bottoming-out process. The IT index has advanced further into the improving quadrant and is expected to start relatively outperforming the broader markets.
Important Note: RRG™ charts show the relative strength and momentum for a group of stocks. In the above chart, they show relative performance against NIFTY500 Index (Broader Markets) and should not be used directly as buy or sell signals.
Milan Vaishnav, CMT, MSTA
Consulting Technical Analyst,


