With geopolitical tensions subsiding, the market had a quiet week as it continued to post a small amount of incremental gains. The trading range also remained capped due to the market oscillating in a capped range. While showing no volatility at all, the NIFTY made minor advancements on the higher side, though it remains below the critical pattern resistance levels on the weekly charts. The quiet week ultimately saw the NIFTY ending with net gains of 95.55 points (+0.78%) on a weekly basis.
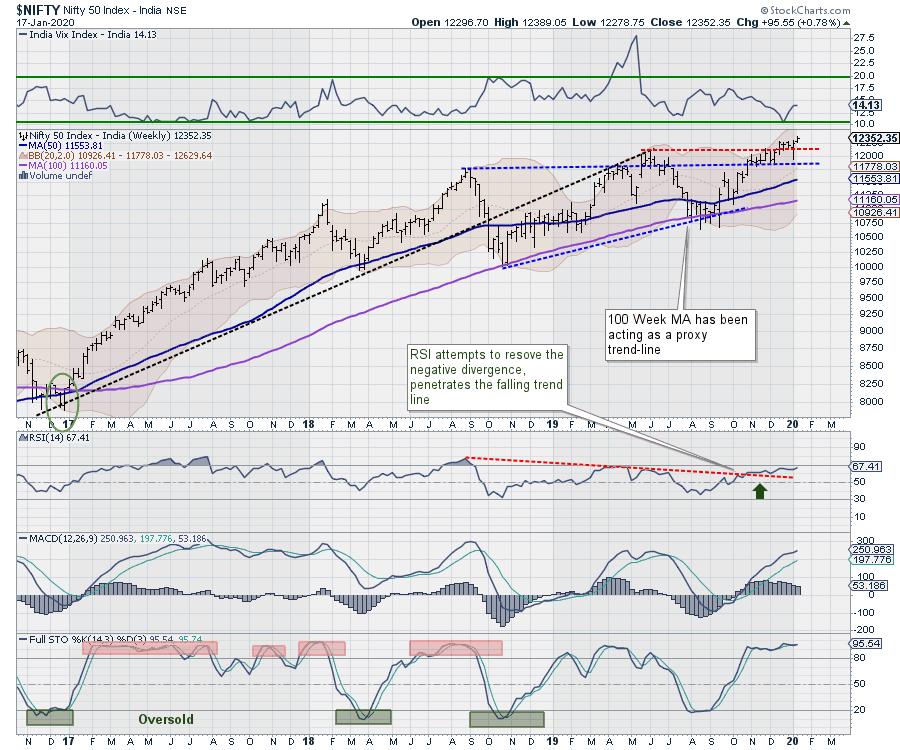
From a technical perspective, the NIFTY continues to stay very critically poised. The markets have posted incremental gains, but is yet to give any clear breakout on the daily as well as the weekly charts. NIFTY presently trades just below the important pattern resistance, as evident from the chart. A convincing move above 12400 will be needed to attempt a sustainable breakout on the higher timeframe charts. The volatility factor also remained under check as the India VIX remained flat and gained just 0.36%, compared to 10.89% a week before.
The markets are likely to see a stable start to the week. The trading range is expected to widen compared to the previous week. The levels of 12450 and 12490 will act stiff overhead resistance levels, while supports will come in at 12260 and 12185 levels.
The Relative Strength Index (RSI) is 67.41; it has made a marginal 14-period high. However, the RSI does not show any divergence against the price. The weekly MACD remains bullish as it trades above its signal line.
A white body emerged on the candles. However, apart from this, no other formations were seen on the charts.
The pattern analysis of the weekly chart shows that the NIFTY has marked an incremental high on the charts and appears to be attempting a breakout. However, the index is presently trading below its multi-month-long trend line, which is preventing a clean breakout.
After having halted its up move in the 12300-12350 zones for four weeks in a row, the NIFTY has attempted to move above this zone. However, as mentioned below, it has a major pattern resistance to deal with near the 12400 levels. The NIFTY will have to move past this level convincingly in order to attempt a sustainable breakout going ahead. We recommend continuing to protect profits at higher levels, as the internal strength is not as much as it should have been at the present high levels. It will also be prudent to continue staying stock-specific as well. A cautiously positive outlook is advised for the coming week.
Sector Analysis for the Coming Week
In our look at Relative Rotation Graphs®, we compared various sectors against CNX500 (NIFTY 500 Index), which represents over 95% of the free float market cap of all the stocks listed.
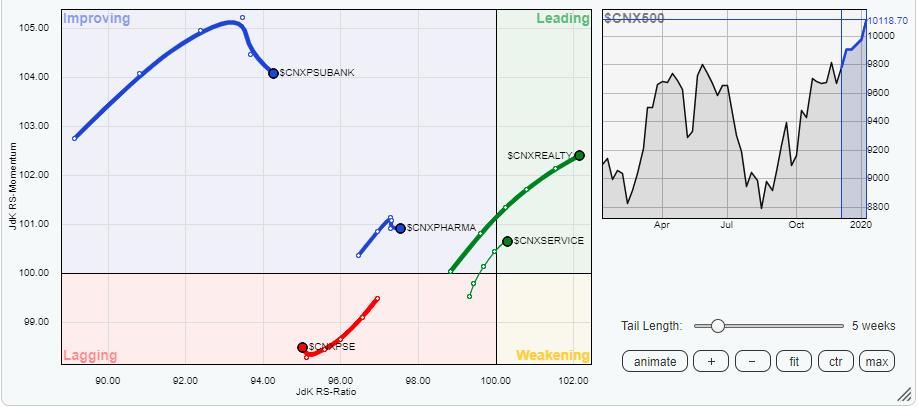
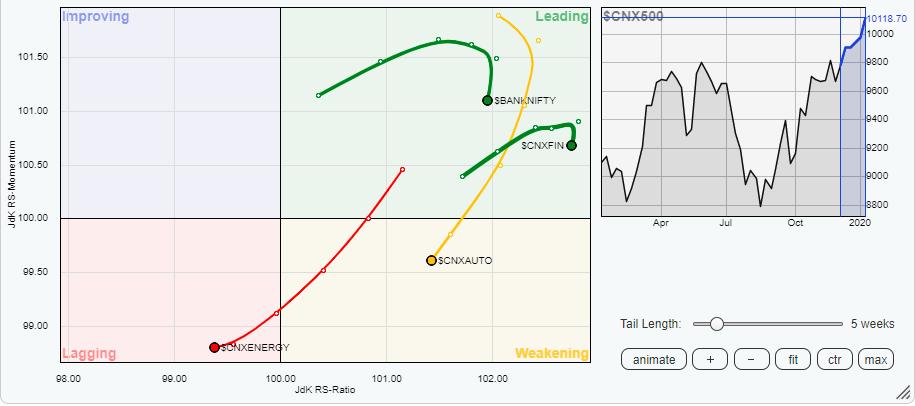
Our review of Relative Rotation Graphs (RRG) shows that some vital sector rotation has been taken place over the previous week. The financials were showing good resilience and relative outperformance over the past couple of weeks, but they are now evidently slowing down. The Financial Services index and the BankNIFTY are seen losing their relative momentum despite staying the leading quadrant. The PSU Bank Index is also faltering midway while remaining in the improving quadrant.
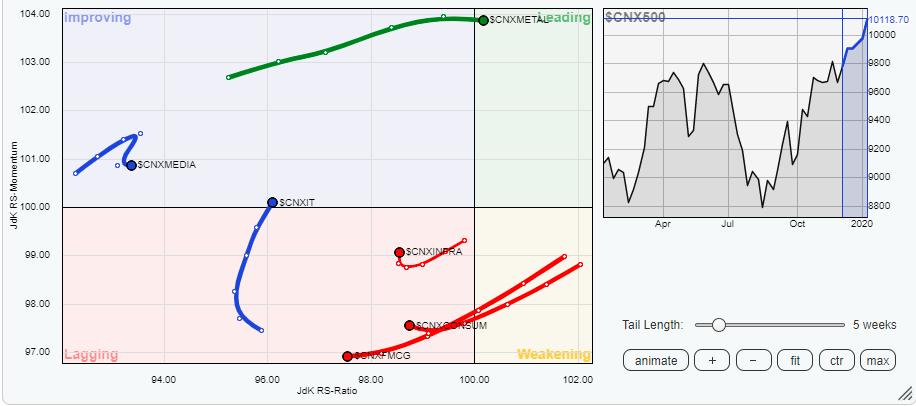
On the other hand, the Realty Index, Metal, and Services sector indexes are appearing to be assuming leadership with respect to relative outperformance. The Metal Index has crawled into the leading quadrant, whereas the Realty and the Services indexes are seen crawling further in the leading quadrant.
The IT index appears to have completed its bottoming process, as it has just entered the improving quadrant.
Apart from this, the Auto, Energy, Consumption, FMCG and PSE groups are seen continuing to slow down further and are likely to underperform the broader markets relatively.
Important Note: RRG™ charts show the relative strength and momentum for a group of stocks. In the above chart, they show relative performance against NIFTY500 Index (Broader Markets) and should not be used directly as buy or sell signals.
Milan Vaishnav, CMT, MSTA
Consulting Technical Analyst,


