The previous week saw the markets consolidating in a 256-point move, as the headline index NIFTY50 ended flat with a negligible gain. After bouncing off from the 50-week MA in the earlier week, the NIFTY continued to trade near its critical zone of 12100-12225 throughout the week while making no directional move on either side. While it remained in a defined range, the headline index ended with a minor gain of 15.10 points (+0.12%) on a weekly note.
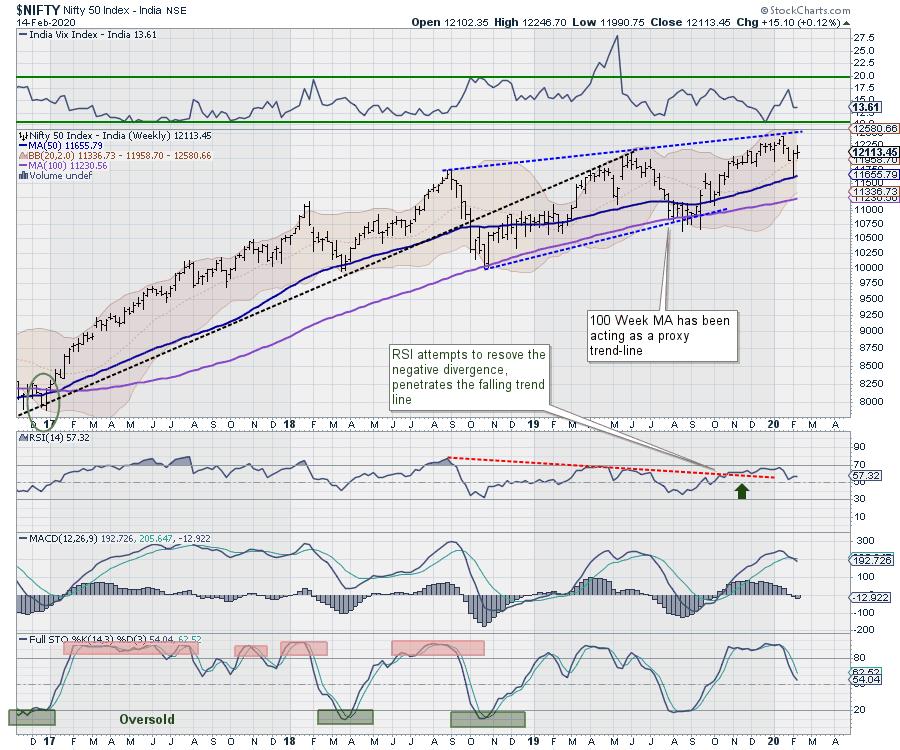
From a technical perspective, the NIFTY continues to remain poised at a critical juncture. The weekly options data shows a predominantly high Call Open Interest built up at 12200. This makes this level a strong resistance point for the week. The India Volatility Index has remained flat throughout the week, declining just 0.96% to 13.61. From the weekly perspective, the 20-week MA presently stands at 11958; any close below this would also mean a loss of momentum over the weekly charts as well.
The coming week is likely to see a tepid start as the NIFTY is seen struggling with the critical levels on both the daily and weekly charts. The levels of 12250 and 12360 will act as strong overhead resistance points, while supports will come in at the 11950 and 11900 levels.
The Relative Strength Index (RSI) on the daily chart is 57.32; it is neutral and does not show any divergence against the price. The weekly MACD is bearish and trades below its signal line. On the candles, a Doji Star occurred. Such a formation occurs when there is a lack of consensus among the market participants. Formation of a doji has the potential to either stall a rally temporarily or mark a likely reversal point.
The pattern analysis of the weekly chart shows that the NIFTY is back inside the broad trading range again after bouncing off its 50-Week MA a week before. However, with the markets continuing to stay in a broad range, it continues to remain vulnerable at higher levels.
In the event of any corrective move, the volatility is likely to increase from the present levels. If the volatility increases, it could cause the INDIAVIX to rise as well. The price action of the NIFTY in the zone of 12100-12250 would be vital to watch. If the NIFTY is not moving past this range, it will increase its vulnerability to any profit-taking move from the current levels. It is strongly recommended that you stay away from creating large long positions; it will be more prudent to stay stock-specific. While continuing to adopt a cautious approach, all up moves, if any, should be used for protection of profits.
Sector Analysis for the Coming Week
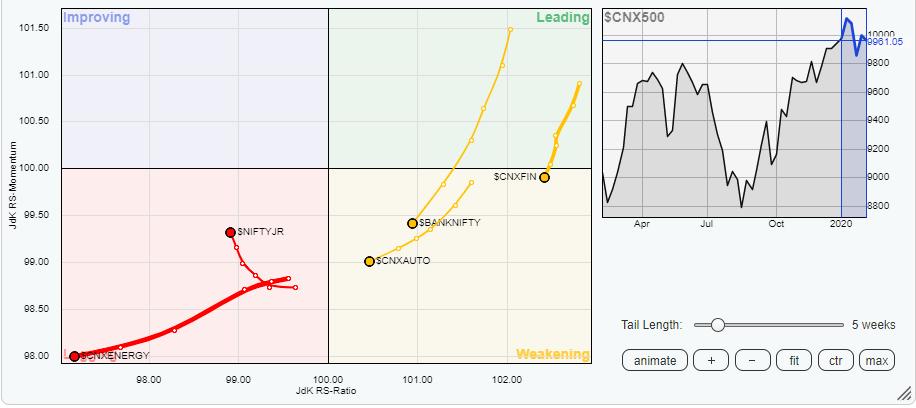
In our look at Relative Rotation Graphs®, we compared various sectors against CNX500 (NIFTY 500 Index), which represents over 95% of the free float market cap of all the stocks listed.
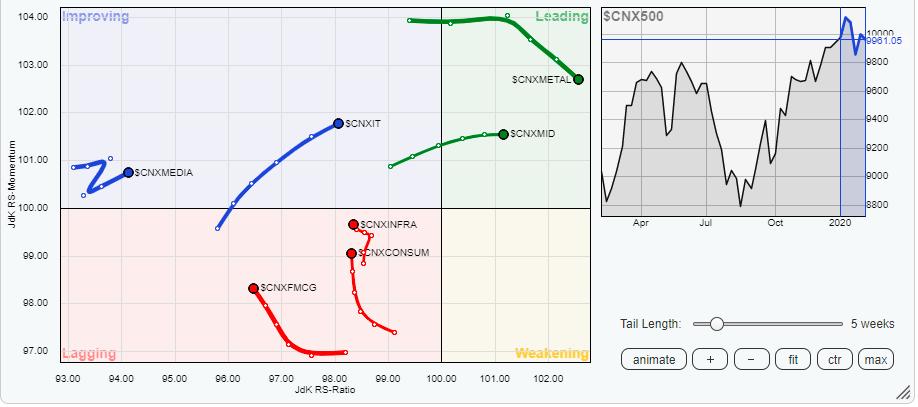
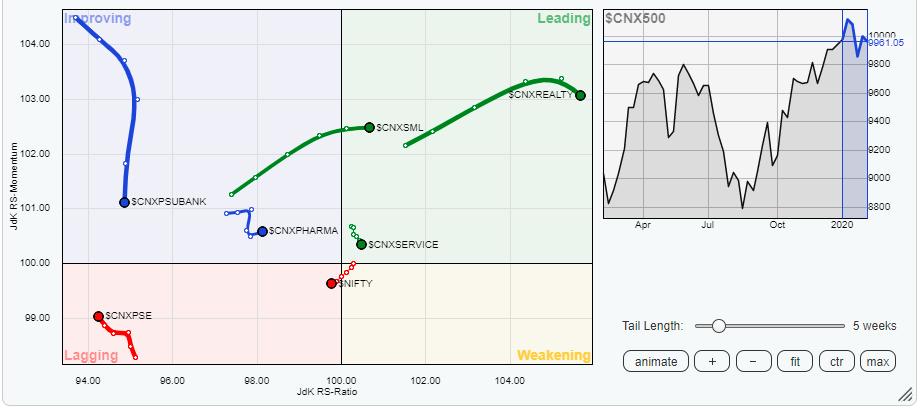
Our review of Relative Rotation Graphs (RRG) shows that, from the sectoral point of view, only the Realty and the Metal indexes are placed in the leading quadrant, though it appears to be losing mildly on the relative momentum. If we look at the broader indexes, the Mid-cap and the Small-cap indexes are also placed in the leading quadrant. All these groups are likely to show relative outperformance against the broader NIFTY500 index.
The larger pockets of the markets, like the NIFTY 100 and NIFTY 200 indexes, are seen moving ahead in the lagging quadrant. Apart from this, the other vital sectoral indexes, like the Financial Services sector, Auto and BankNIFTY, are also seen slipping further in to the weakening quadrant. The Energy Group is seen heading further southward in the lagging quadrant, as is the PSU bank index, which is seen sharply losing its relative momentum and rotating unfavorably.
The NIFTY IT index is seen heading firmly ahead while being placed in the improving quadrant; it is likely to contribute as one of the relative outperformers against the broader markets. The FMCG and the Consumption groups are seen in the process of arresting their underperformance; some stock-specific action from these groups may not be ruled out.
Important Note: RRG™ charts show the relative strength and momentum for a group of stocks. In the above chart, they show relative performance against NIFTY500 Index (Broader Markets) and should not be used directly as buy or sell signals.
Milan Vaishnav, CMT, MSTA
Consulting Technical Analyst,


