While trading just on the anticipated lines, the Indian equity markets continued to consolidate around critical levels throughout the previous week, ending flat with negligible loss. Just as mentioned and expected in the last weekly note, the NIFTY did not make any major headway; the upsides stayed limited and within a capped range. While continuing to stay within the broad trading range and keeping its head above the critical short-term support, the NIFTY ended with a minor loss of 32.60 points (-0.27%).
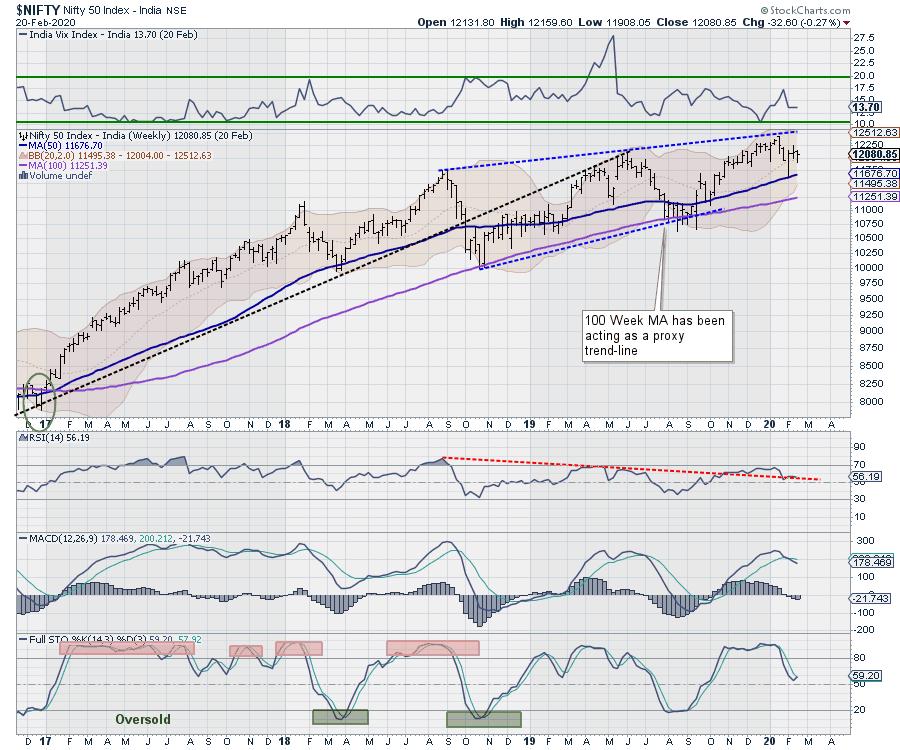
Speaking from a technical perspective, the NIFTY has managed to keep its head above the short-term 20-Week MA, which is currently at 12004. Over the coming days, it will be critically important for the index to stay above this level; failing that, we may see incremental weakness in the markets. The India Volatility Index (INDIAVIX) increased by 0.62% to 13.70. Short-covering from the lower levels and unwinding from higher levels is what characterized the markets through the previous week.
The coming week is likely to see a soft and lackluster start, and the levels of 12080 and 12170 will act as overhead resistance. The supports will come in at 11930 and 11850 levels. In the event of any corrective, the range on the downside is expected to get wider than usual.
The Weekly Relative Strength Index (RSI) is 56.19; it remains neutral and does not show any divergence against the price. The Weekly MACD is bearish and trading below its signal line. A Doji had occurred in the week prior to this week; this time, it was followed up by a candle with a long lower shadow. Both such candles indicate indecisiveness on the part of market participants and may temporarily stall any present up move.
The pattern analysis of the weekly chart shows that the NIFTY continues to remain within a broad trading range. Apart from this, it hovers around the important double top resistance level that exists near the 12100 levels. As of today, it has kept its head above the 20-Week MA, which is currently placed at 12004. Any slip below the 20-Week MA will increase the possibilities of the NIFTY testing its 50-Week MA over the coming week.
All in all, the NIFTY is less likely to show any meaningful upside over the coming week. On the other side, any slip below the 20-Week MA will invite incremental weakness in the markets. Any pullback that was witnessed over the past couple of days has been solely on the back of short-covering, as it has happened with a decline in net Open Interest. Given this technical setup, we would strongly recommend remaining light on the positions and continue using upsides, if any, to protect profits at higher levels.
Sector Analysis for the Coming Week
In our look at Relative Rotation Graphs®, we compared various sectors against CNX500 (NIFTY 500 Index), which represents over 95% of the free float market cap of all the stocks listed.
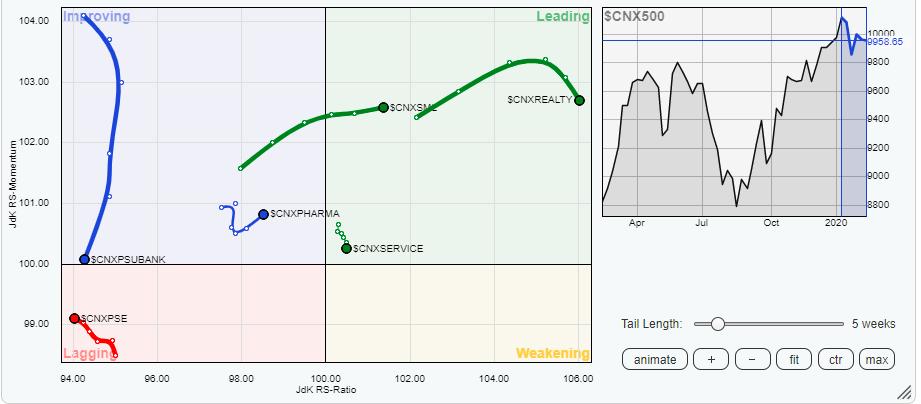
The review of Relative Rotation Graphs (RRG) shows that the coming week will continue to see relative outperformance from the Small-cap and the Mid-cap groups in a stock-specific manner, as these groups are seen rotating favorably while staying in the leading quadrant. The Realty and Metal indexes are also in the leading quadrant, but they are seen to be gradually paring their relative momentum. However, stock-specific outperformance cannot be ruled out.
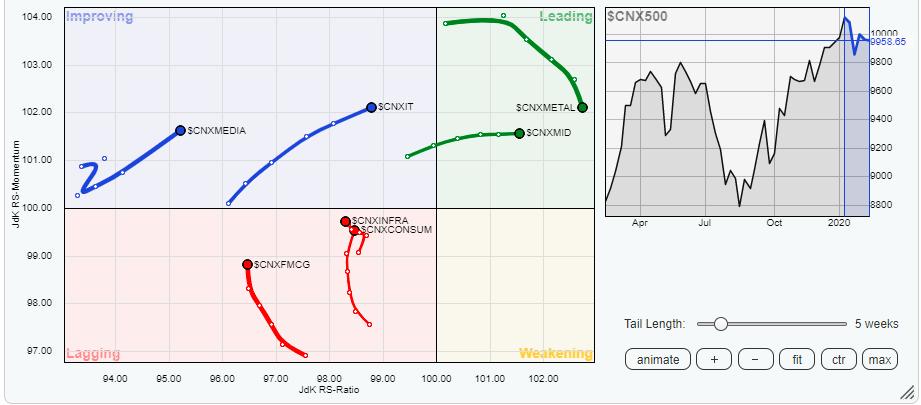
Along with this, we can also see the IT sector, Media and Pharma groups favorably rotating while remaining in the improving quadrant, as they are seen incrementally building upon their relative momentum. They may also stay resilient and relatively outperform the broader NIFTY500 index.
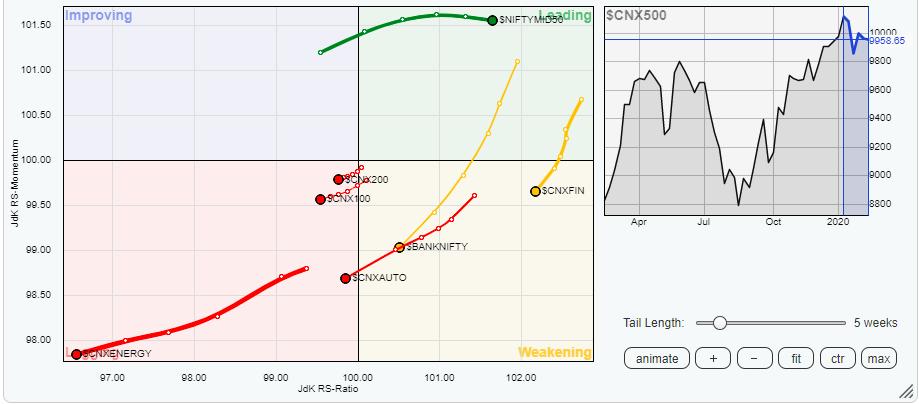
The BankNIFTY and Financial Services indexes are slipping into the weakening quadrant while Auto has entered the lagging quadrant. In addition, the Energy and the PSUBank groups are also seen continuing to lose ground consistently. These groups, collectively, are likely to underperform the broader markets on a relative basis. The FMCG and Consumption index, along with the Infrastructure group, is seen to be in the process of bottoming out in the near term, but they still have some ground left to cover before they complete this process.
Important Note: RRG™ charts show the relative strength and momentum for a group of stocks. In the above chart, they show relative performance against the NIFTY500 Index (Broader Markets) and should not be used directly as buy or sell signals.
Milan Vaishnav, CMT, MSTA
Consulting Technical Analyst,


