The global scare of an economic slowdown following the outbreak of coronavirus saw the world markets taking a severe knock, and Indian equities were no exception. While trading on anticipated lines, the Indian equity markets saw a wide-ranging week wherein the headline index NIFTY moved in the range of 606 points. With the pressuring remaining consistent at higher levels, no rebound was seen during the week, and the NIFTY ended the week with a net loss of 212.30 points (-1.90%).
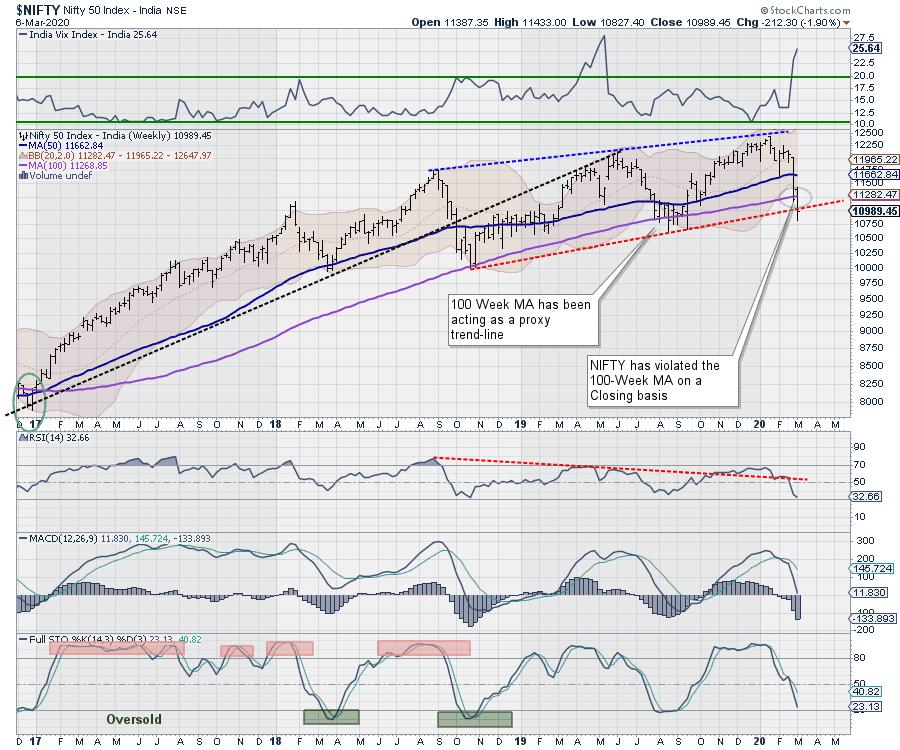
The week that went by saw some critical technical levels being violated on the weekly charts. The 100-Week MA, which is presently at 11259, had been acting almost as a proxy trend line for the last couple of months. Said trend line had formed the lower end of the broad trading range that the index was trading over the past months. This support has been violated on a closing basis, and any technical pullback will see this level acting as a resistance. The India Volatility Index (INDIAVIX), which had shot up 69.60% in the week before this, saw a spurt of another 10.35% to 25.64.
The coming week, which is a truncated week with Tuesday being a trading holiday on account of Holi, is expected to see NIFTY making violent efforts to gain some stability and attempt a technical rebound. The levels of 11090 and 11250 will act as resistance. The supports will come in at 10900 and 10760.
The Relative Strength Index (RSI) on the weekly chart is 32.66; it has marked a fresh 14-period low, which is bearish. The weekly RSI does not show any divergence against the price. The weekly MACD is bearish and trades below its signal line. The MACD is above its centerline, but it appears to be moving towards it for a negative crossover over the coming weeks. A long black body emerged on the candles, which inherently implies a strong momentum towards the downside over the past several days.
The pattern analysis of the weekly chart shows that we are in for a reversal of trend if the NIFTY fails to move past the 100-Week MA. While the index violated and closed below the 100-Week MA, it has also broken the broad trading range that the NIFTY was trading in once it disrupted its 36-month long upward rising channel.
All in all, we can reasonably expect some attempts by the markets to pull back as it stands oversold on short-term time frame charts. However, from a weekly perspective, it has violated crucial pattern support at the 100-week MA. So, unless the NIFTY manages to crawl above the 100-week MA, which presently stands at 11259, it will remain susceptible to selling pressure at higher levels, which may result in not only a continued downtrend but also a reversal of the primary multi-year uptrend.
Given a large amount of shorts that exist in the system, any technical short-covering-led rebound should not come as a surprise. However, rather than chasing this up move, if it at all happens, the price behavior of the NIFTY against the levels of 11250 should be closely observed.
Sector Analysis for the Coming Week
In our look at Relative Rotation Graphs®, we compared various sectors against CNX500 (NIFTY 500 Index), which represents over 95% of the free float market cap of all the stocks listed.
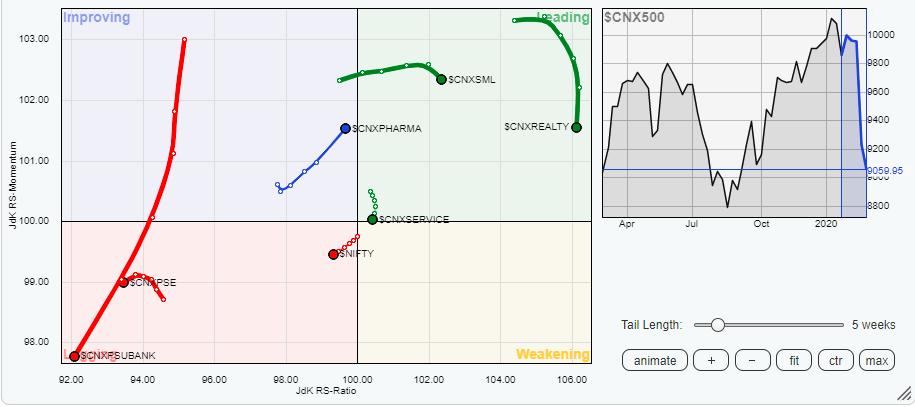
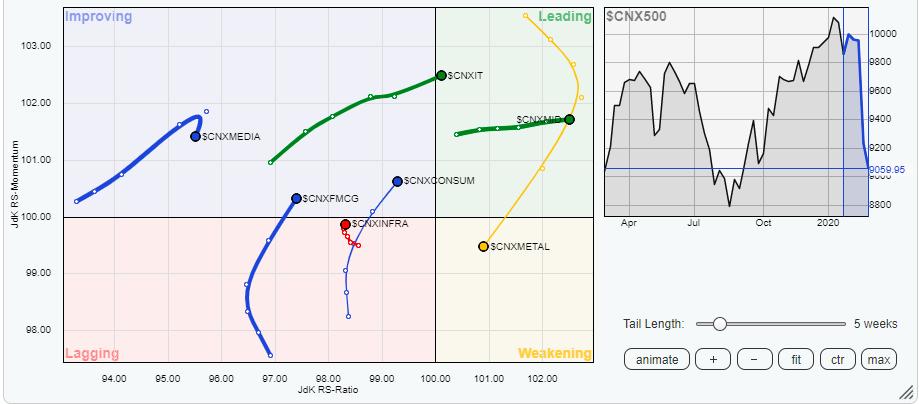

The review of Relative Rotation Graphs (RRG) shows that NIFTY IT, Pharma, Consumption and FMCG are rotating favorably. While the IT group has entered the leading quadrant, the FMCG has crawled in the improving quadrant. The Consumption and Pharma groups also appear to be building up momentum while staying in the improving quadrant. These groups are likely to put up a resilient show over the coming week and are likely to relatively outperform the broader markets collectively. The Realty index is presently in the leading quadrant, but it is seen losing on its relative momentum.
The key indexes, like Metals, have crawled in the weakening quadrant along with the NIFTY Financial Services index. The BankNIFTY, Auto and Energy groups are seen sliding further in the lagging quadrant. These sectors are unlikely to put up any good show and are likely to underperform the broader markets collectively along with the PSU Bank index, which has taken a nose dive back in the lagging quadrant.
Some isolated stock-specific outperformance from the Infrastructure pack may not be ruled out; it appears to be moving towards the improving quadrant, but has not yet completed its bottoming-out process.
Important Note: RRG™ charts show the relative strength and momentum for a group of stocks. In the above chart, they show relative performance against NIFTY500 Index (Broader Markets) and should not be used directly as buy or sell signals.
Milan Vaishnav, CMT, MSTA
Consulting Technical Analyst,


