The previous week saw one of the worst sell-offs of the decade when the global markets reacted with absolute panic to the spread of the coronavirus, and the Indian markets were affected as well. The global financial markets went in disarray as the world grappled with the possibility of the coronavirus becoming a pandemic over the coming days. While witnessing an across-the-board liquidation, the markets ended the week with a massive cut of 879.10 points (-7.28%). The decline remained one of the worst declines after the international financial crisis of 2008.
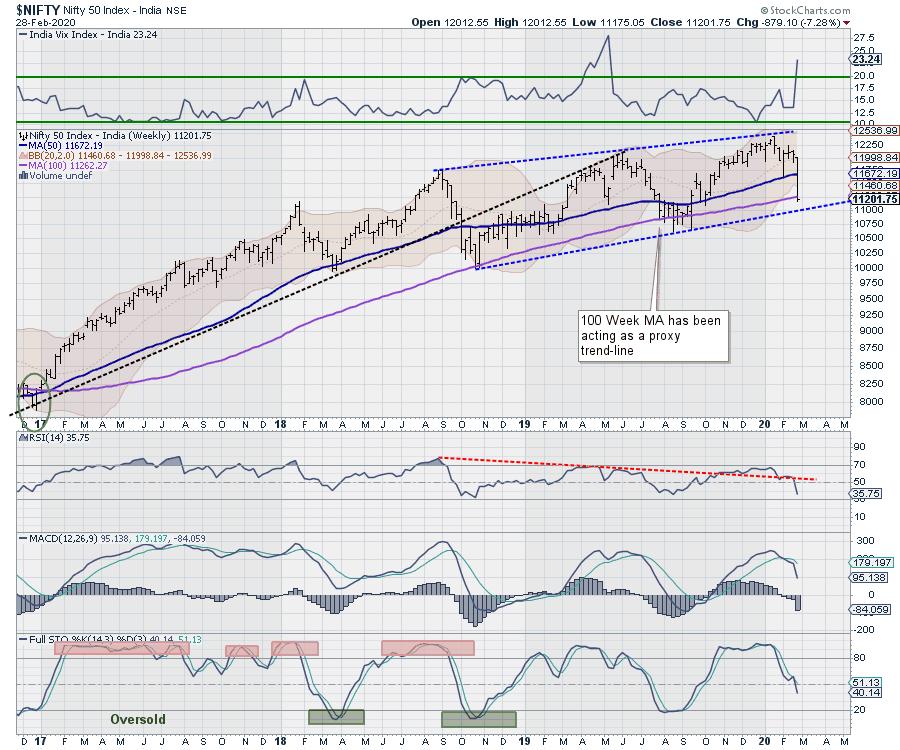
Despite an 837-point one-way decline, the NIFTY has ended near the low point of the week. The India Volatility Index (INDIAVIX) rose by a massive 69.60% to 23.24, which remains a multi-month high value for INDIAVIX. The NIFTY has also ended a notch below the 100-Week MA, which presently stands at 11251. Although there is no apparent structural breach on the weekly chart, the NIFTY now stands at a critical 17-month long trend line support in the zone of the 11125-11250 levels.
What is next in store for the investors after witnessing one of the most brutal selloffs in the previous decade? The answer to this will lie in correlating the short-term daily charts to longer-term weekly charts. First of all, when the global markets across the globe react to any situation with an enormous amount of panic, it gets challenging to mark a bottom as the technical levels tend to get easily violated. However, if we take a broader view of the technical setup, it would certainly give some idea as to what to expect over the coming days.
The coming week may see a positive start initially as the markets may attempt to find a bottom, given the extremely oversold nature on the short-term charts. The NIFTY is likely to trade in a much wider-than-usual range, with the levels of 11325 and 11460 acting as resistance. The supports will come in at the 11100 and 10910 levels.
The weekly RSI stands at 35.75; it has marked a fresh 14-period low, which is bearish. The RSI does not show any divergence against the price. The weekly MACD is bearish as it trades below its signal line. A large black body emerged on the candle. The size of the black candle highlights the amount of selling pressure that the markets witnessed throughout the week.
While having a look at the pattern analysis, we see that the NIFTY has not shown any structural pattern breakdown on the longer-term weekly charts. It is apparent that the index trades within the broad trading range that has formed over the past 18 months. The NIFTY has not yet violated this broad trading zone. The 100-Week MA has been acting as a proxy trend line, as evident from the chart. The trend line below that is expected to act as important pattern support, at least in the near term.
As we deal with the coming week, we expect the markets to initially show some technical pullbacks. However, such pullbacks, if they occur, should be closely watched, as the NIFTY may not give any runaway rise in equal proportion to its decline. There is a higher chance that we see the NIFTY consolidating a broad range while it stays in the process of finding a bottom. While any aggressive purchases should be avoided, profits on either side should be vigilantly protected. Volatility, overall, is expected to come down in the event of any consolidation in the markets.
Milan Vaishnav, CMT, MSTA
Consulting Technical Analyst,


