We are using Line Charts, as they enable us to take a look at the longer-term structure of the weekly charts. We do this so that we can examine the behavior of the markets against the decade-long trend line, which now stands violated. After a massive decline of over 12% a week before this, the NIFTY decelerated its decline and ended with a modest loss. The line charts do not show any significant activity, but the week has been a wide-ranging week. The NIFTY traded in an extensive range of 1527 points. However, despite oscillating in such a wide range, the headline index ended the week with a net loss of just 85.20 points (-0.97%).
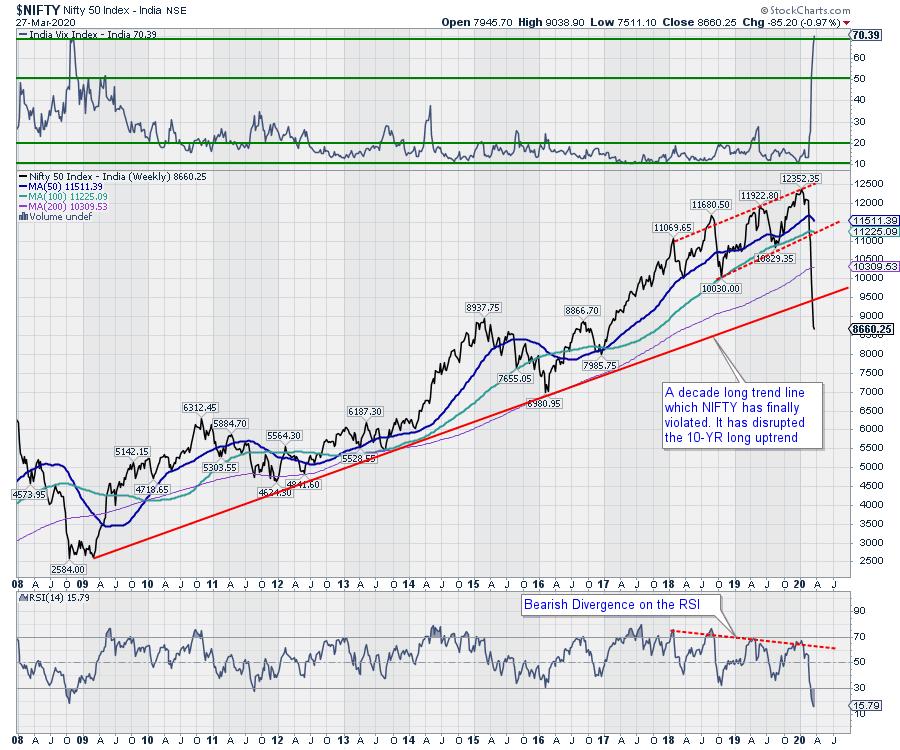
The middle of the week saw volatility spiking up as the India Volatility Index, INDIAVIX, shot to its lifetime high. Though it cooled off by the end of the week, it still ended with a surge of 4.90% to 70.39. The entire week saw the rise in the domestic markets purely on the back of short-covering. The buying, at any stage, remained absent. We have a truncated week ahead, with Thursday being a trading holiday on account of Ramnavmi. There are chances that we may see markets halting their upsurge and slipping into corrective mode again.
The coming week is expected to see a weak start if the US markets end negative on Friday. The negative undertone of the global setup is likely to get extended on Monday, which may lead to a modest start to the session. The trading range may not remain as wide as the previous week; the levels of 8790 and 9000 will act as resistance while supports will come in at the 8230 and 7960 levels.
The Relative Strength Index (RSI) on the weekly chart is 15.79; it has marked a fresh 14-period low, which is bearish. RSI, however, remains neutral and does not show any divergence against the price. The weekly MACD is bearish and trades below its signal line. No significant formations were seen on the candles.
The pattern analysis continues to present a grim picture. The NIFTY has violated a more than a decade-long upward rising trend line. After slipping below the trend line, the markets have shown no inclination to pull back on a weekly basis. Whenever the pullback occurs on a weekly note, the trend line will act as a strong resistance and would limit the extent of the pullback.
There is no doubt that the markets have attempted to form a base for themselves. However, in the same breath, they have not shown any signs of the confirmation of the attempted bottom. Unless we get a confirmation signs of a potential bottom formation, chasing up moves will not be a prudent thing to do; more so when the rallies are fueled by just short-covering. We will need to support all future rallies with strong buying; until this happens, the sustainability of any up moves will be doubtful.
Despite some aggressive measures announced by the Finance Minister and the RBI, the markets gave up the majority of their gains on the last trading day of the week. The steps from the Government and the RBI are nothing but an acknowledgment of something already evident, which is that the economy is facing very tough times ahead. We recommend approaching the coming week on a highly cautious note without getting carried away with the pullbacks, if any.
Sector Analysis for the Coming Week
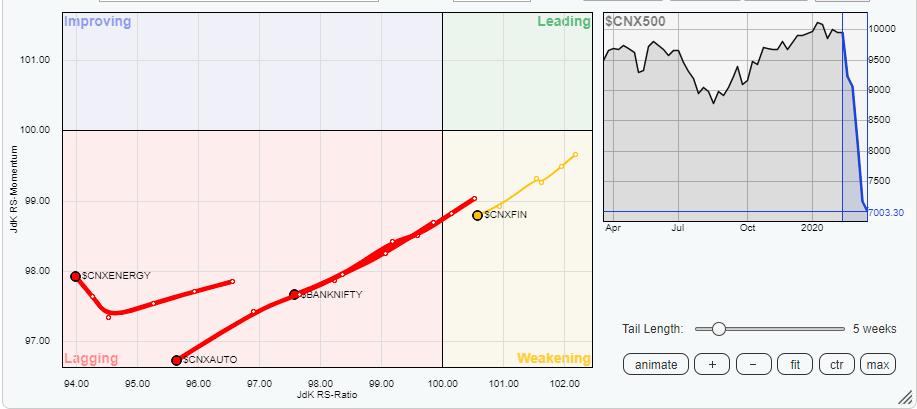
In our look at Relative Rotation Graphs®, we compared various sectors against CNX500 (NIFTY 500 Index), which represents over 95% of the free float market cap of all the stocks listed.
The review of Relative Rotation Graphs (RRG) shows a cluster of these sectors that will continue to be a safe haven amidst these difficult times.
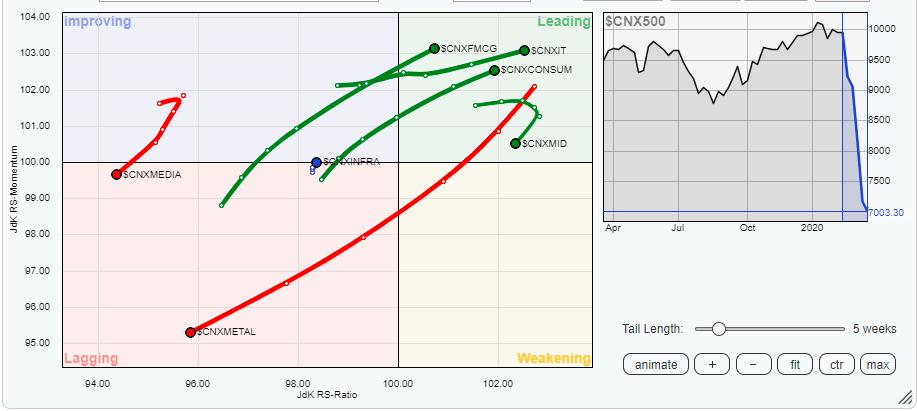
The Pharma, Consumption, FMCG and IT are the groups in the leading quadrant. Along with being placed in the leading quadrant, they are maintaining their relative momentum and are likely to outperform the broader markets collectively relatively.
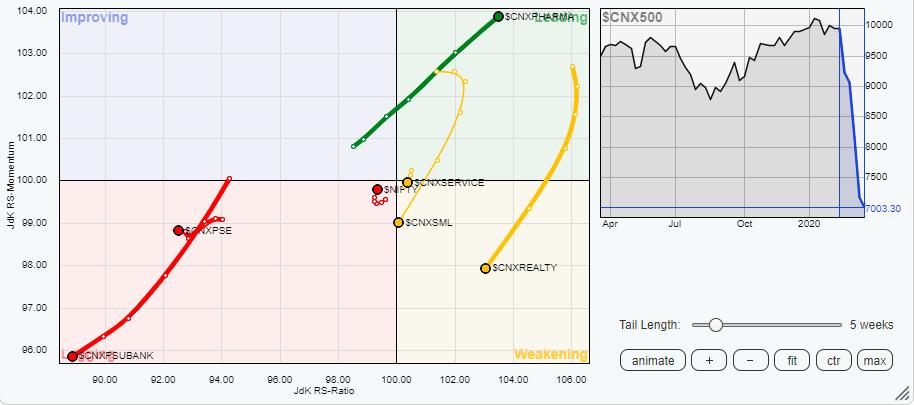
The Infrastructure and the Services indexes are attempting to crawl back inside the improving quadrant and leading quadrant, respectively. However, there is hardly any momentum seen in these groups, and this will hinder their relative performance over the coming days.
All of the other remaining key sectors like BankNIFTY, Realty, Energy, Auto, Metals, Media, Commodities and the Financial Services, are likely to underperform the broader markets relatively. These groups are seen losing relative momentum and drifting lower while remaining in the weakening and lagging quadrant.
Important Note: RRG™ charts show the relative strength and momentum for a group of stocks. In the above chart, they show relative performance against NIFTY500 Index (Broader Markets) and should not be used directly as buy or sell signals.
Milan Vaishnav, CMT, MSTA
Consulting Technical Analyst,


