After taking a breather the week before this one, the Indian equity market resumed its downtrend again and ended this week with a net loss. With this week's decline, the NIFTY has, as of now, has declined nearly 35% on a closing basis. A week before, NIFTY had witnessed wide oscillation of over 1500 points intra-week, but, on the closing basis, the losses were capped by just 85 points. This time, the situation was different; the range remained narrower at 623 points, while the index closed with a net weekly loss of 576.45 points (-6.66%).
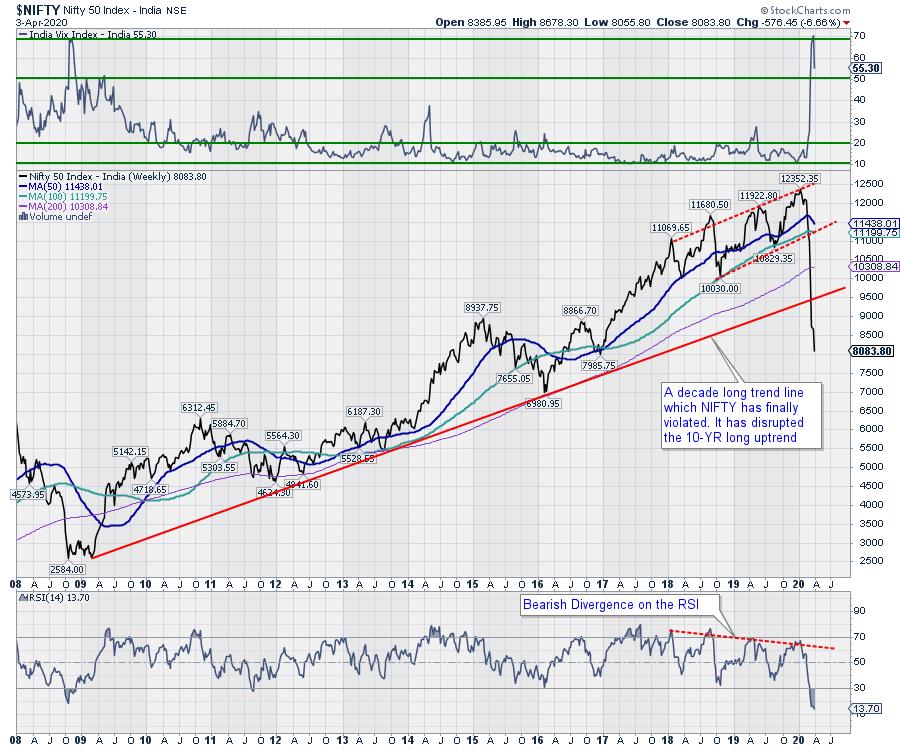
At the present technical juncture, we need to take a look at a couple of points. Despite the ever-continuing fear and uncertainty over the COVID-19 pandemic, all global markets, including India, have shown some possibilities of arresting the downside, or that of a measured technical pullback as they stand miserably oversold. The previous week also saw volatility declining significantly as the India Volatility Index (INDIAVIX) fell by 21.43% to 55.30. From the high, the INDIAVIX has come off over 30%, which is a good sign that lays some ground for a technical pullback.
The coming week will be short 3-day trading week, with both Monday and Friday being trading holidays on account of Mahavir Jayanti and Good Friday.
The Indian markets are expected to see an uncertain start on Tuesday, as the Markets will open after a gap of one day and will adjust to the global trade setup. Having said this, the levels of 8190 and 8430 will act as resistance, while supports will come in at 8000 and 7835 levels.
The weekly RSI stands at 13.70; it continues to remain deeply oversold and well below 30. The RSI has marked a fresh 14-period low, which is bearish, but remains neutral and does not show any divergence against the price. The weekly MACD is bearish and trades below its signal line.
The pattern analysis shows some mild signs of the markets attempting a technical pullback again. This week had a lower top but much higher bottom; this signifies some respite from the downward pressure and also shows the low of the previous week as a potential short-term base for the markets. That being said, though some technical pullback cannot be ruled out, they will remain measured and limited in their extent given the break of a major trend line by the NIFTY.
Of late, the volumes have remained on the lower side. This trend is likely to remain over the next couple of days as well. The coming week, which is a highly truncated one, will also see a dearth of volumes, which may make it difficult for NIFTY to sustain any directional move. In any case, given the current technical setup, we recommend avoiding shorts at current levels. The downsides may be used to make moderate purchases. Without taking any significant directional exposures, a cautiously positive outlook is advised for the week.
Sector Analysis for the Coming Week
In our look at Relative Rotation Graphs®, we compared various sectors against CNX500 (NIFTY 500 Index), which represents over 95% of the free float market cap of all the stocks listed.
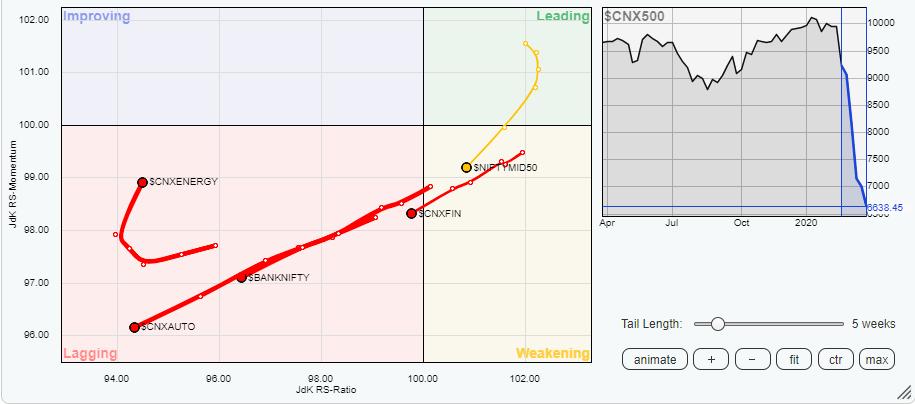
Our review of Relative Rotation Graphs (RRG) shows how the following sectors continued to outperform the broader markets on the expected lines relatively, along with how they are likely to continue doing so in the coming week as well.
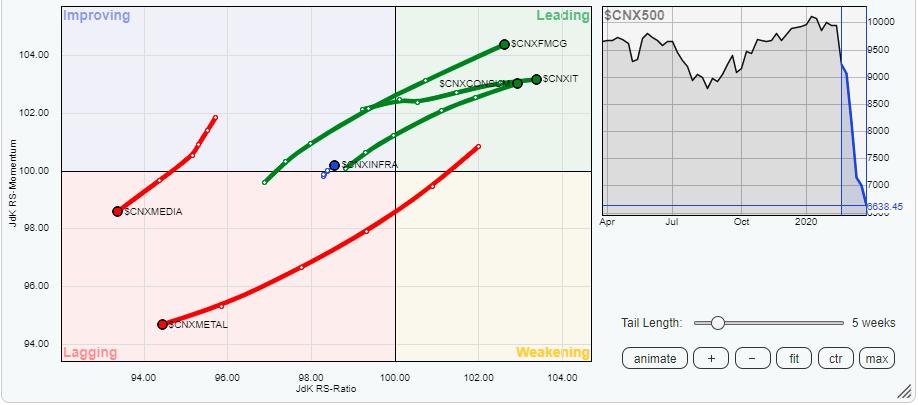
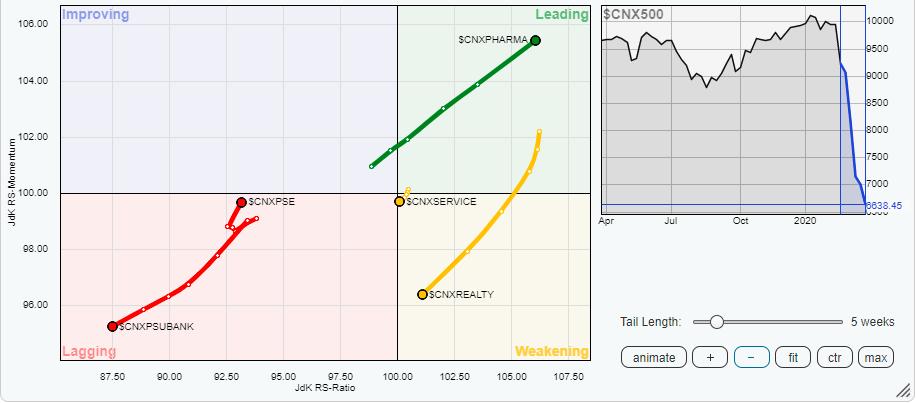
The Pharma, FMCG, Consumption and IT indexes appear to be marching firmly in the leading quadrant. These indexes are also maintaining their relative momentum and will continue outperforming the broader NIFTY500 index on a relative basis. The Infrastructure index has crawled in the improving quadrant and looks to have consolidated itself. Stock-specific outperformance cannot be ruled out from this group.
The NIFTY PSE and the NIFTY Energy indexes have arrested their underperformance. They are attempting a positive rotation towards the improving quadrant. However, they are yet to complete their bottoming-out process entirely.
All other key indexes, such as NIFTY Bank, Realty, Auto, Metals, Commodities, Services, Financial Services, PSU Bank and Media, are continuing to lose their relative momentum, while remaining in the weakening and lagging quadrants. These groups will underperform the broader markets collectively.
Important Note: RRG™ charts show the relative strength and momentum for a group of stocks. In the above chart, they show relative performance against NIFTY500 Index (Broader Markets) and should not be used directly as buy or sell signals.
Milan Vaishnav, CMT, MSTA
Consulting Technical Analyst,


