After a sharp technical pullback in the week before this one, the Indian equities continued with the extension of the pullback, but on a very modest note. The trading range over the past five days remained broad, as the NIFTY oscillated in a 500-point range but kept the net incremental gains quite limited. Given the near-oversold nature of the markets on the higher time-frame, the NIFTY extended its gains on the anticipated note. The headline index ended with the net gains of 154.85 points (+1.70%) on a weekly basis.
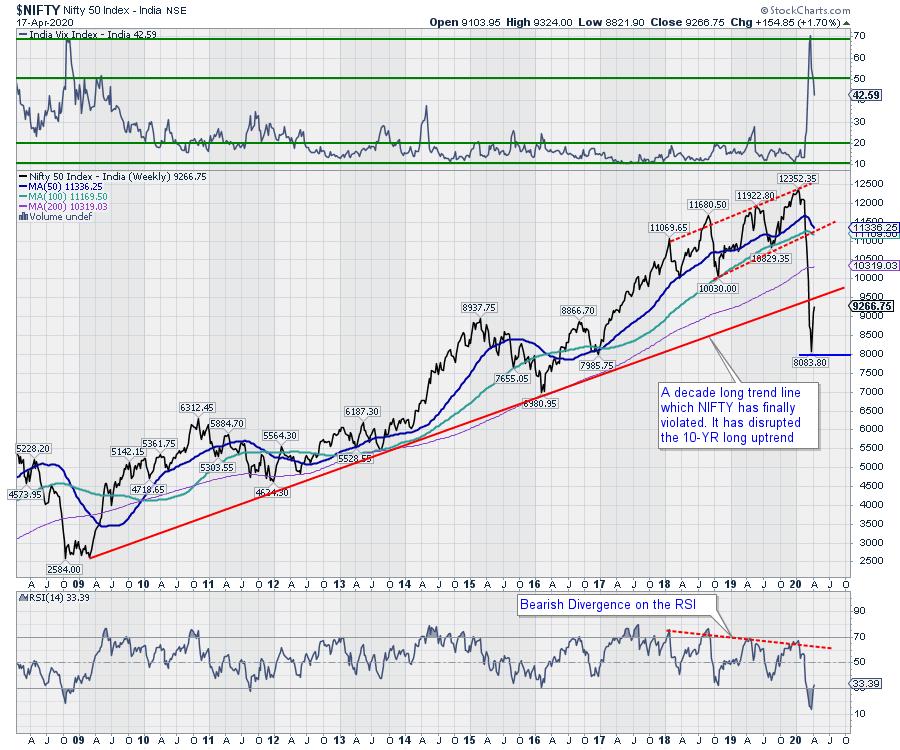
If we take stock from a technical perspective, the NIFTY has pulled back nearly 1170 points, or 14%, from the immediate closing levels. Looking at this another way, the Indian equity markets have relatively underperformed their global peers, again on the expected note. Over the past week, the volatility has continued to cool down as the India Volatility Index (INDIAVIX) significantly declined by another 14.38% to 42.59. On the daily charts, the Index has formed a classic wedge, which usually resolves in the direction of the preceding trend. This means the coming week is crucial for the Indian equity markets.
The following week is likely to see a quiet start to the day. The levels of 9350 and 9535 are overhead resistance points. The support comes in lower at 9165 and 8935 levels. The trading range for the week ahead is likely to stay broader, just like the previous week.
The weekly RSI is 33.39; it remains neutral and does not show any divergence against the price. The weekly MACD is bearish and trades below the signal line. A candle with a long lower shadow occurred on the chart. This is not a classic hanging man pattern, but the longer-than-normal shadow indicates a mild loss of momentum in the technical pullback.
The pattern analysis does not show anything different than the previous week. The NIFTY declined sharply, violating the 11-year long upward rising trend line. After becoming deeply oversold, it has pulled back ~14% from the most recent lows on a closing basis.
On the weekly chart, there is still some room for the markets to continue with the pullback. However, the loss of momentum remains a worry for the near term. Also, on the shorter time frame charts, the technical setup is not so encouraging. Given the slightly divergent technical structure on the daily and the weekly charts, we strongly recommend continuing to approach the week with a considerable amount of caution. While taking each day as it comes, no longer or extended directional positions should be taken, and profits on either side should be vigilantly protected.
Sector Analysis for the Coming Week
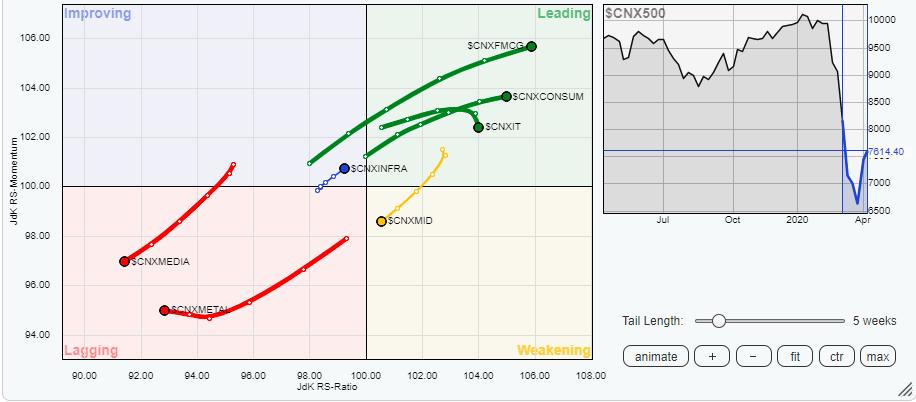
In our look at Relative Rotation Graphs®, we compared various sectors against CNX500 (NIFTY 500 Index), which represents over 95% of the free float market cap of all the stocks listed.
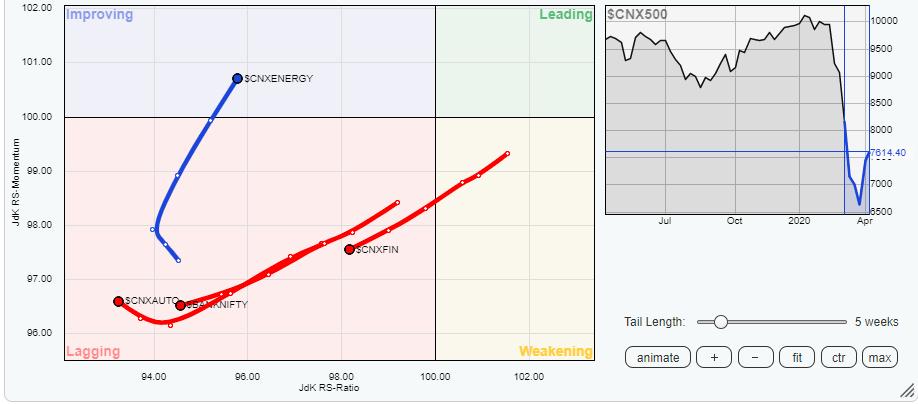
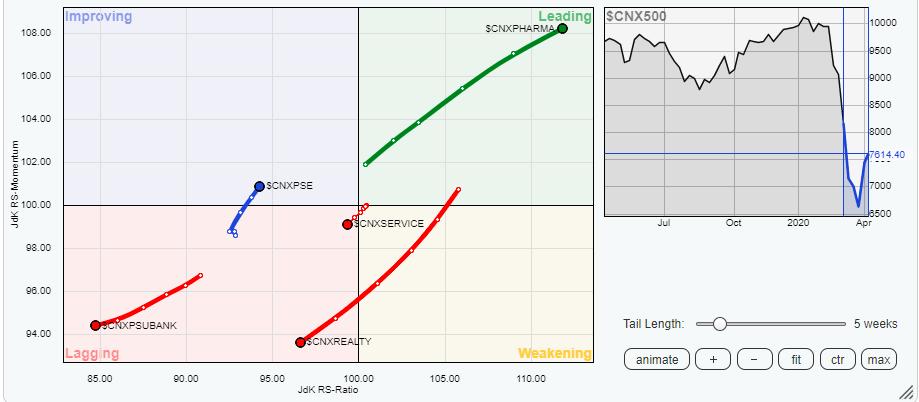
Our review of Relative Rotation Graphs (RRG) shows that some positive rotation that appeared in the Energy and PSE groups has continued this week as well. The Energy, PSE and Infrastructure groups have continued to rotate positively while staying in the improving quadrant.
The NIFTY Pharma, Consumption, FMCG and IT continue to remain in the improving quadrant. However, among these four groups, the IT appears to be losing relative momentum. The remaining three groups may continue to relatively outperform the broader NIFTY500 Index, but the IT index may show some signs of tiredness at present levels. So, Pharma, Consumption and FMCG are likely to continue to relatively outperform the broader markets, while Infrastructure, Energy and the PSE groups will contribute to the relative outperformance selectively.
Although Auto and the Commodities group have attempted to arrest their decline, they haven't completed their bottoming-out process. Other key indexes like BankNIFTY, PSU Banks, Financial Services, Services, Metals, Media and Realty continue to languish and are likely to underperform the broader markets relatively.
Important Note: RRG™ charts show the relative strength and momentum for a group of stocks. In the above chart, they show relative performance against NIFTY500 Index (Broader Markets) and should not be used directly as buy or sell signals.
Milan Vaishnav, CMT, MSTA,
Consulting Technical Analyst


