After several negative weekly closes, the Indian equity markets finally ended their losing streak this truncated week as they finally finished with gains. In our previous weekly note, we had categorically mentioned the possibilities of a sharp technical pullback despite ongoing uncertainties because of the outbreak of COVID-19. While trading precisely on the anticipated lines, the NIFTY staged a robust relief rally and ended with solid gains of 1028.10 points (+12.72%) on a weekly note.
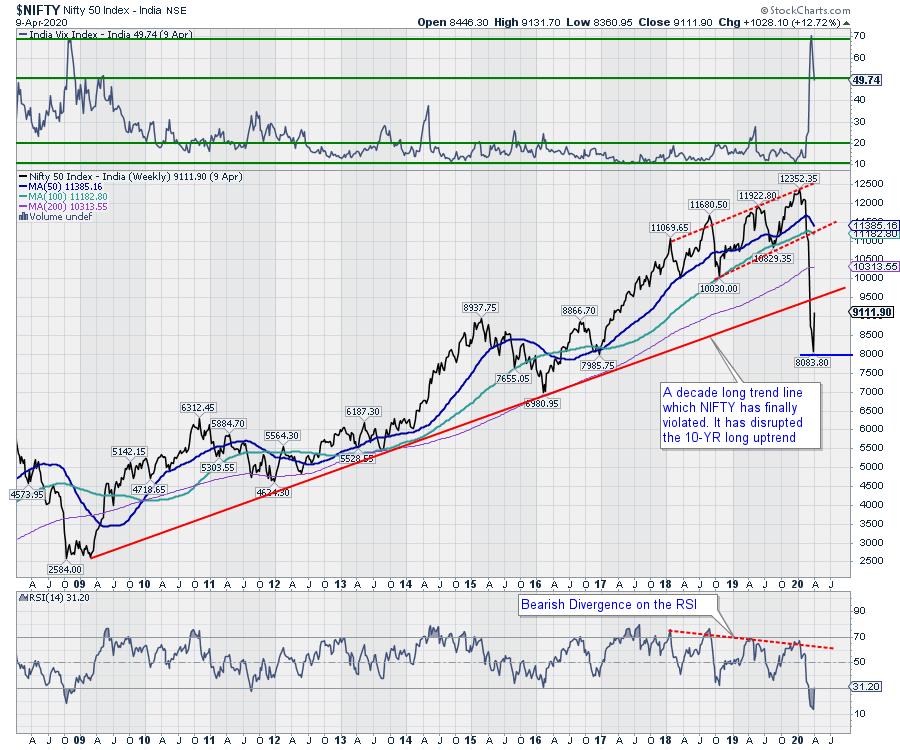
The NIFTY has pulled back around 20% from its lows. The extent of the pullback, though, was not surprising, as such pullbacks do occur when the markets are such deeply oversold after a steep decline, such as the recent one. The index has just put a temporary bottom for itself in place while it stays in the intermediate trend for some time. The volatility continued to cool off as the India Volatility Index, INDIAVIX, came off by another 10.05% to 49.74. The coming week is also a truncated one, as Tuesday is a trading holiday on account of Dr. Baba Saheb Ambedkar Jayanti.
The coming week is likely to see a stable start, and there is some room for the technical pullback extending as well. The levels of 9310 and 9465 will act as overhead resistance points while supports will come in at the 9010 and 865 levels. The trading range for the markets is likely to stay wider than usual.
The weekly RSI presently stands at 31.20; it has just crossed above 30 from the oversold position, which is bullish. The RSI also remains neutral and does not show any divergence against the price. The weekly MACD is bearish and trades below its signal line.
The pattern analysis of the weekly charts shows that the NIFTY has pulled back after being deeply oversold following a steep decline. The current decline has also seen the index violating the 11-year long upward rising trend line. Despite the recent technical pullback, the NIFTY is trading below its trend line that it recently violated; it also trades below all its key moving averages.
There are mild chances of volatility resurfacing over the coming weeks. Also, although the NIFTY has pulled back over 20% from its lows, it has some more room for extending this technical relief rally. However, in the same breath, it is important to note that the index has just put a temporary bottom in place; it has in no way shown any kind of reversal in the trend, which remains predominantly bearish.
In the event of any continued upside, we recommend staying highly stock- and sector-specific in your approach. We suggest following the uptrend, if any, very cautiously. Keep protecting profits at each higher level, as the markets are not yet out of the woods. While avoiding excessive exposures on either side, a balanced and modest approach is advised for the week.
Sector Analysis for the Coming Week
In our look at Relative Rotation Graphs®, we compared various sectors against CNX500 (NIFTY 500 Index), which represents over 95% of the free float market cap of all the stocks listed.
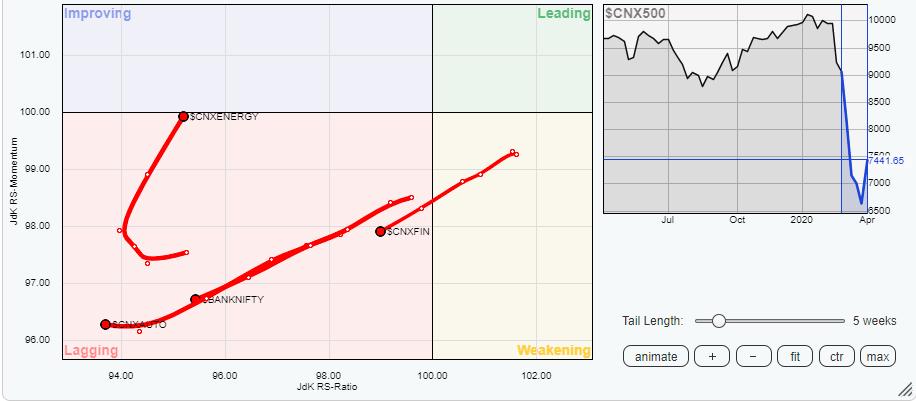
The review of Relative Rotation Graphs (RRG) shows that some positive rotation has appeared in the Energy and PSE groups as well.
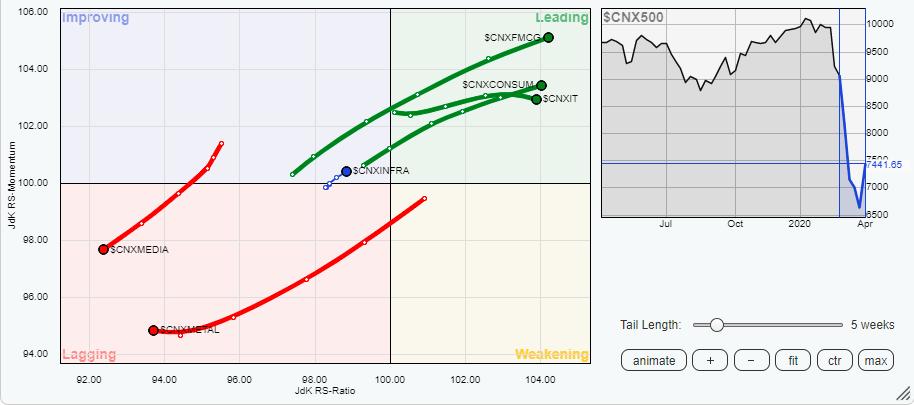
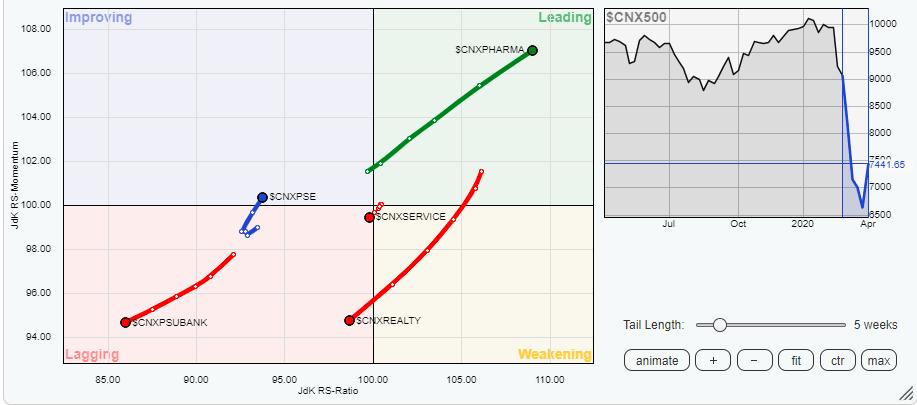
The Pharma, FMCG, Consumption and IT groups are seen maintaining their relative momentum while they are firmly placed in the leading quadrant. These groups are likely to relatively outperform the broader markets. Apart from these, the Energy group has almost completed its bottoming out process and is seen heading firmly towards the improving quadrant. Also, the NIFTY PSE index has crawled in improving quadrant. Both these indexes are likely to put up stock-specific outperformance over the coming days. The NIFTY Infrastructure index also remains in improving quadrant.
Despite individual performance over the previous week, the other key indexes like BankNIFTY, Auto, Metals, Realty, Financial Services, PSU Banks Services Sector indexes and the Media group are continuing to head lower while remaining in the lagging quadrant. They show no signs of arresting their broader downtrends or of any bottoming out.
Important Note: RRG™ charts show the relative strength and momentum for a group of stocks. In the above chart, they show relative performance against NIFTY500 Index (Broader Markets) and should not be used directly as buy or sell signals.
Milan Vaishnav, CMT, MSTA
Consulting Technical Analyst


