The past couple of days performed much along the anticipated lines as the markets, in general, continued to portray a bearish undertone and ended the weak on a negative note. After halting the pullback, the NIFTY has formed a lower top near 9900 levels and continued its slide, confirming the same level as a lower top. In the week that went by, the Index formed a similar high, but a lower low highlighted the inherent weakness. After trading in a nearly 550-point range, the headline index ended with a net weekly loss of 114.65 points (-1.24%). The NIFTY Bank remained relatively weaker, ending with a net weekly loss of 518.95 points (-2.68%).
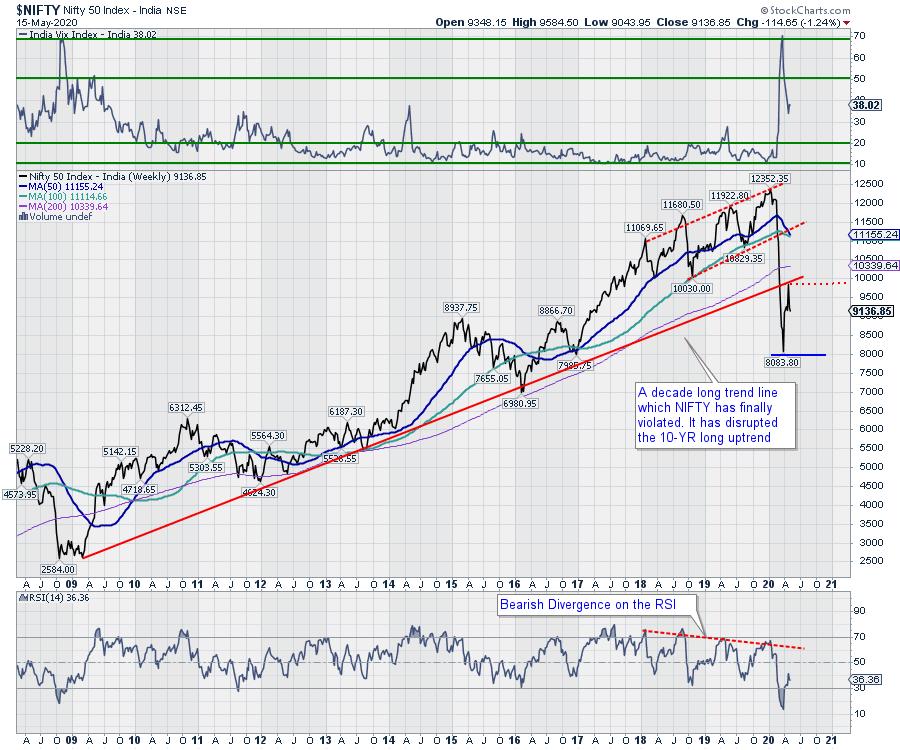
The volatility pattern has shown concerning behavior, as it has not surged in its otherwise normal proportion of the decline in NIFTY over the previous week. This demonstrates a directional consensus with a negligible amount of panic demonstrated by the market participants. During the last week, the India Volatility Index, INDIAVIX, declined marginally by 1.02% to 38.02. On the weekly charts, the NIFTY has shifted its resistance significantly lower to the 9800-9900 zones. With the NIFTY trading below the multi-year-long trend line, the primary uptrend remains disrupted as of today.
Markets do not look much enthused with the fiscal stimulus that is being released in a portion every day. A soft start is expected for the week. The levels of 9235 and 9510 will act as overhead resistance points. The supports will come in at the 9000 and 8835 levels. The trading range is expected to widen in the coming week.
The weekly RSI is 36.36; it remains neutral as it shows no divergence against the price. The weekly MACD is still bearish as it trades below its signal line. Apart from a black body that emerged, no other formations were noticed on the candles. The PPO remains negative.
There was not much change in the pattern that was observed in the previous week. The week before the last had seen the formation of a lower top on the weekly chart near the 9900 levels. The decline was extended over the past couple of days, which has held the multi-year trend line as a rock-solid resistance for the markets. The violation of this trend line had resulted in disruption of the multi-year primary uptrend in the markets.
All in all, the markets may continue to trade while exhibiting a bearish bias over the coming days. The declines may not be steep and intensive, but the upside, if there is any, will continue to remain capped. The stock actions will revolve around the defensive stocks, and it will remain highly stock- and sector-specific in nature. The bottom-line of the analysis of the coming week is to refrain from chasing any up moves, if there are any, while staying away from creating any aggressive positions on either side. A cautious approach is advised for the days ahead.
Sector Analysis for the Coming Week
In our look at Relative Rotation Graphs®, we compared various sectors against CNX500 (NIFTY 500 Index), which represents over 95% of the free float market cap of all the stocks listed.
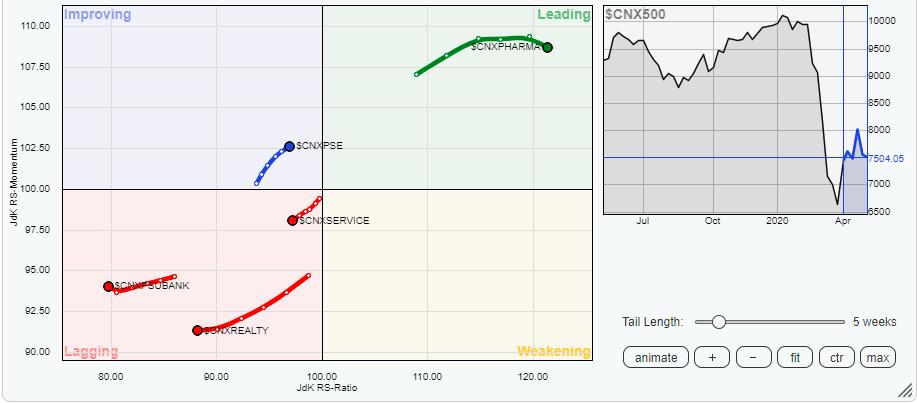
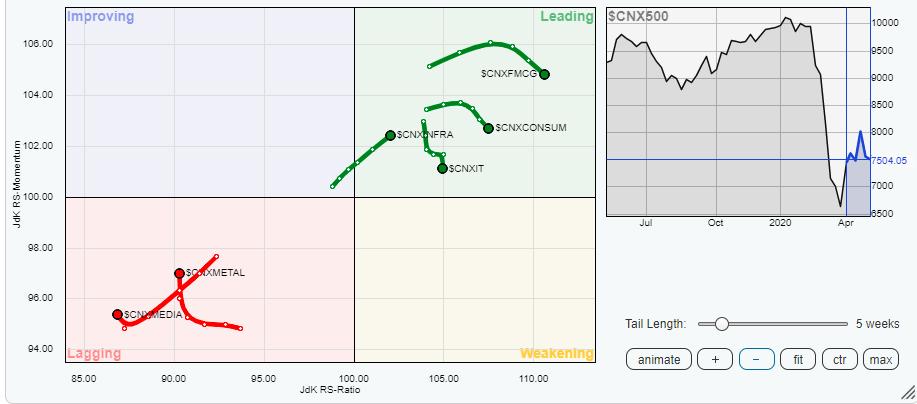
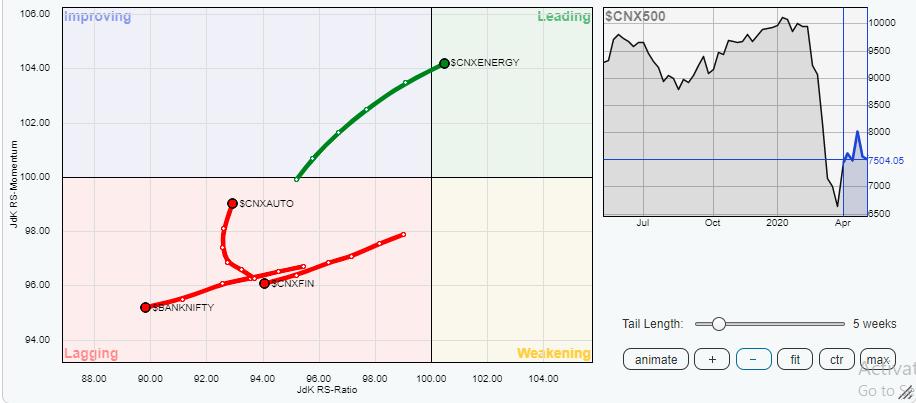
The review of Relative Rotation Graphs (RRG) shows that the NIFTY Energy Index has advanced in the leading quadrant. Along with this, the Infrastructure Index, Pharma, FMCG and Consumption Indexes appear comfortably placed in the leading quadrant of the RRG. These groups are likely to outperform the broader NIFTY500 Index relatively.
The IT Index is also currently placed in the leading quadrant. However, it appears to be losing its steam and seems to be topping out for the time being. The NIFTY PSE Index is rotating steadily while being placed in the improving quadrant.
The Auto and the Metal Indexes are rotating strongly towards the improving quadrant. However, they remain in the lagging quadrant and the bottoming out process would complete only after they enter the improving quadrant. However, presently, any shorting in these groups should be avoided.
Financials, along with other key Indexes, remain weak. The PSU Banks, BankNifty, Services, Financial Services, Media and Realty continue to be in the lagging quadrant. These groups will still relatively underperform the broader NIFTY500 Index.
Important Note: RRG™ charts show the relative strength and momentum for a group of stocks. In the above chart, they show relative performance against NIFTY500 Index (Broader Markets) and should not be used directly as buy or sell signals.
Milan Vaishnav, CMT, MSTA
Consulting Technical Analyst,


