Markets ended a week that continued to play out much on the expected lines, except for the fact that the volatility was much less than what was expected. Also, the markets continued to display lack of directional bias throughout the week. Despite making a sharply lower top and lower bottom for this week, the trading range also remained less wide than anticipated. The NIFTY oscillated in a 371-point range over the last five days. While not taking any significantly decisive directional bias, it continued with the modest down-tick as the headline Index ended with a modest loss of 97.60 points (-1.07%) on a weekly basis.
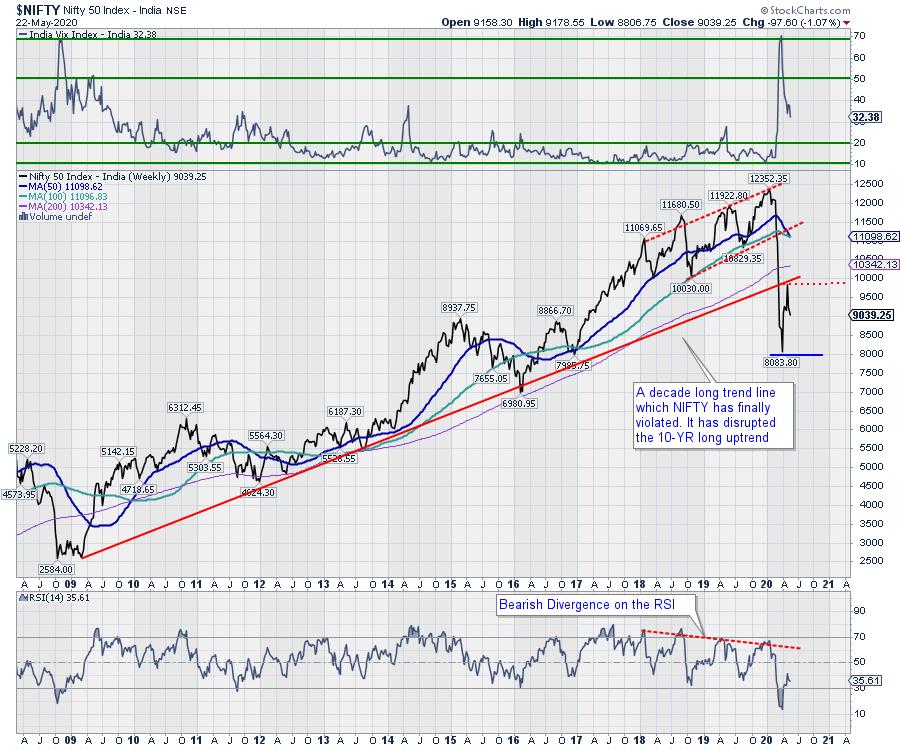
The coming week will be a short and truncated one, as Monday is a trading holiday for observance of Ramzan Id. Markets are expected to continue to exhibit tentative-to-bearish bias and are unlikely to show any significant upsides from the current levels. Along with the decline in the NIFTY on a weekly basis, the volatility declined as well. The India Volatility Index (INDIAVIX) came off by 14.84% to 32.38; this continues to remain a matter of concern, as VIX and the Index are usually inversely related.
The Indian markets will open on Tuesday and, as they open, they will adjust to a global trade setup that will transpire on Monday. However, in any case, no significantly wild opening on the higher side is expected. The coming week will see the levels of 9162 and 9235 acting as overhead resistance points. The supports will come in at the 8965 and 8800 levels. Any move on the downside is likely to make the trading range wider than usual.
The weekly RSI is 35.61; it remains neutral and does not show any divergence against the price. The pattern analysis of the indicator shows that it has not been able to penetrate the support line of a pattern which was violated a couple of weeks back. The weekly MACD is bearish; it trades below its signal line. A candle with a long lower shadow appeared on the candles. This creates a case for some resistance on the downside, making the previous week's low a particularly important level to watch. In the present technical setup, it may not result in any significant pullback from the current levels.
The pattern analysis reiterates the earlier setup on the weekly charts. The NIFTY has violated the 11-year long upward rising trend line. While pulling back, it has resisted to the same trend line and has formed a lower top near 9850 levels.
If we take a broader look at the coming week, the markets are unlikely to make any significant directional move on either side. The up moves are likely to stay capped at higher levels. Downsides, as well, will find strong support near the 8800-8850 zone. In other words, the coming week is likely to see a ranged move on either side. We recommend staying away from creating aggressive bets on either side. A highly stock- and sector-specific approach is advised for the week. It is also recommended that you guard profits on either side as well.
Sector Analysis for the Coming Week
In our look at Relative Rotation Graphs®, we compared various sectors against CNX500 (NIFTY 500 Index), which represents over 95% of the free float market cap of all the stocks listed.
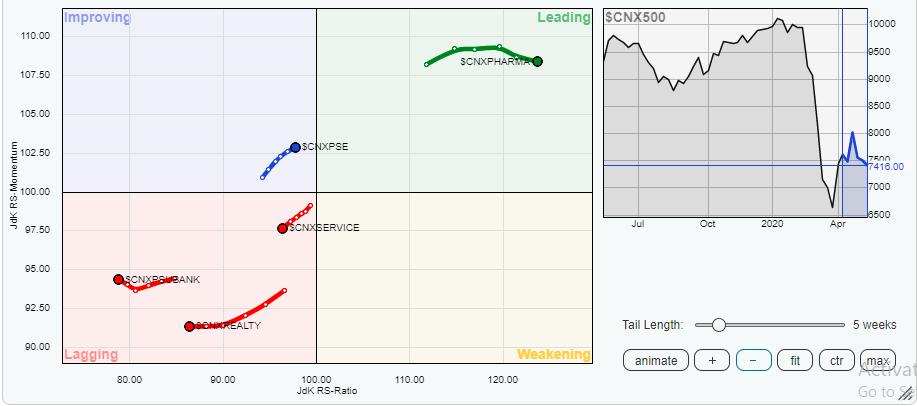
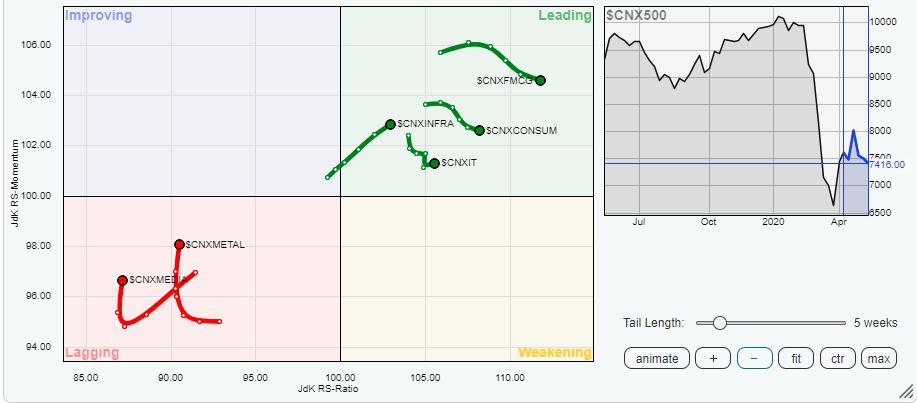
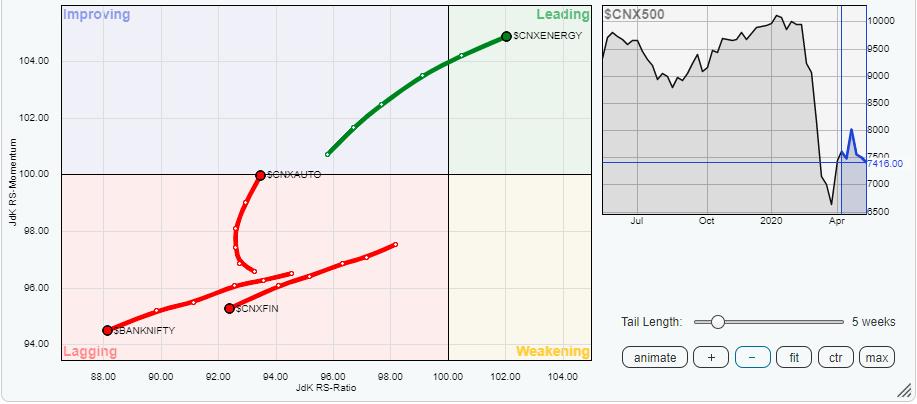
The review of Relative Rotation Graphs (RRG) shows that the IT sector has consolidated again after a minor blip a week before, keeping its relative momentum intact while remaining in the leading quadrant. Along with that, The Pharma, FMCG, Consumption, Energy and Infrastructure groups are still comfortably placed in the leading quadrant. The Pharma, which stays at a maximum distance from the Centre point, is likely to generate maximum alpha over the benchmark NIFTY 500 Index. Collectively, these sectors are likely to outperform the broader markets on a relative basis.
In addition, the Auto Index appears to have competed its bottoming-out process and has just entered the improving quadrant. Apart from this, the Metal and the Media groups appears to have consolidated their downside moves and are attempting to form a base; however, their bottoming-process is still not complete and they are currently placed in the lagging quadrant.
The key sectors that continue to lag the broader markets include Financial Services, the Services sector, Realty, PSU Banks and the Bank NIFTY indexes. Though some selling exhaustion may be observed at few places, broadly speaking, they will relatively underperform the broader markets in the coming week.
Important Note: RRG™ charts show the relative strength and momentum for a group of stocks. In the above chart, they show relative performance against NIFTY500 Index (Broader Markets) and should not be used directly as buy or sell signals.
Milan Vaishnav, CMT, MSTA
Consulting Technical Analyst,


