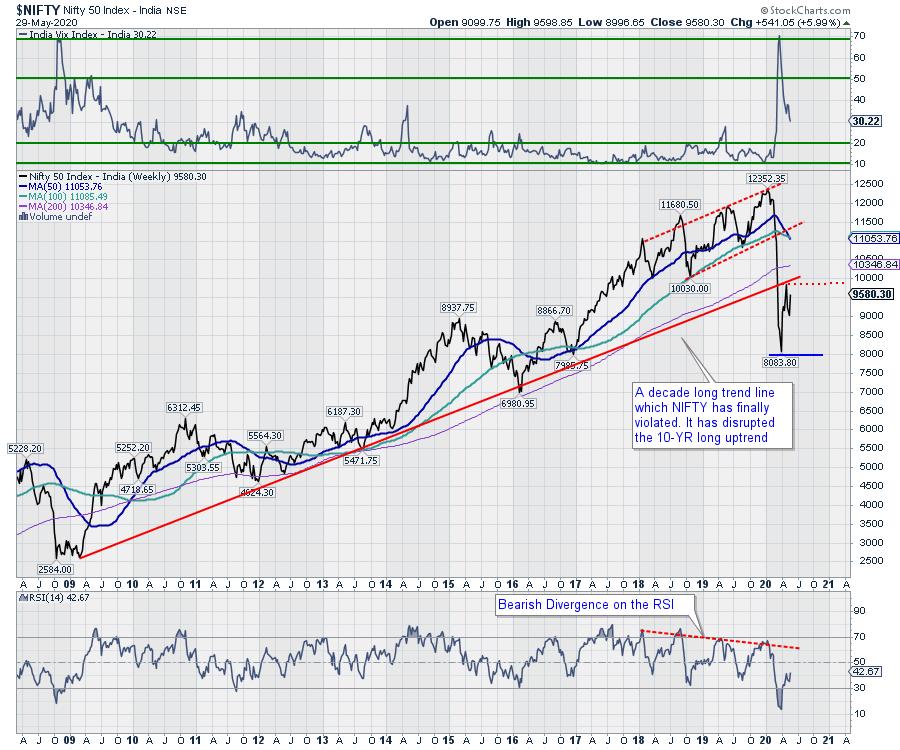
The previous week remained contrary to expectations; instead of staying within ranged movement, it was a wide-ranging one with the Index ending with robust gains. The NIFTY saw a 600-point wide trading range, much broader than expected. The NIFTY pulled back from the low point and finished on a strong note for the last three consecutive days. This led to the NIFTY ending with a strong gain of 541.05 points (+5.99%) on a weekly basis. This also ensured that May remains the one with a limited loss. The headline index ended with a net loss of 279.60 points (-2.84%) on a monthly note.
Two of the three days of the week also were highly dominated by rollover-centric trades. The week also saw both index and stock futures dipping into considerable discount against the spot. The volatility continued to decline as the India Volatility Index (INDIAVIX) came off by 6.66% to 30.22 on a weekly basis. The zone of 9000-9050 has now become a short-term base for the markets, and we expect them to consolidate in a broad range with a positive bias.
Monday is likely to see a quiet start to the week. The trading range is now expected to remain wide, with the levels of 9360 and 9875 acting as resistance points. The supports will come in at the 9510 and 9365 levels.
The weekly RSI is 42.67; it has made a fresh 14-period high, which is bullish. The RSI continues to remain neutral, as it does not show any divergence against the price. The weekly MACD continues to stay bearish as it trades below its signal line. However, the slope of the histogram suggests sharply diminishing momentum on the downside, which is, in a way, positive in the near term. A white body appeared on the candles; apart from this, no other significant formations were seen.
The pattern analysis presents an interesting picture. After violating the decade-old trend line, the NIFTY pulled back sharply from the lower levels, but halted exactly at the trend line that it had violated. In the present case, the NIFTY appears to be trying to move to that resistance point again.
From the technical perspective, a risk-on environment is building up. Given such a setup, we will see the NIFTY attempting to move higher with every decline. However, the NIFTY has risen over 550 points in three consecutive days, which may lead to some profit-taking or wide-ranged consolidation at higher levels. It is recommended to guard profits at higher levels. In the event of any moves towards the 9800-9950 zones, all profits should be vigilantly protected, and aggressive buying should be avoided. A continued cautious approach is advised for the coming week.
Sector Analysis for the Coming Week
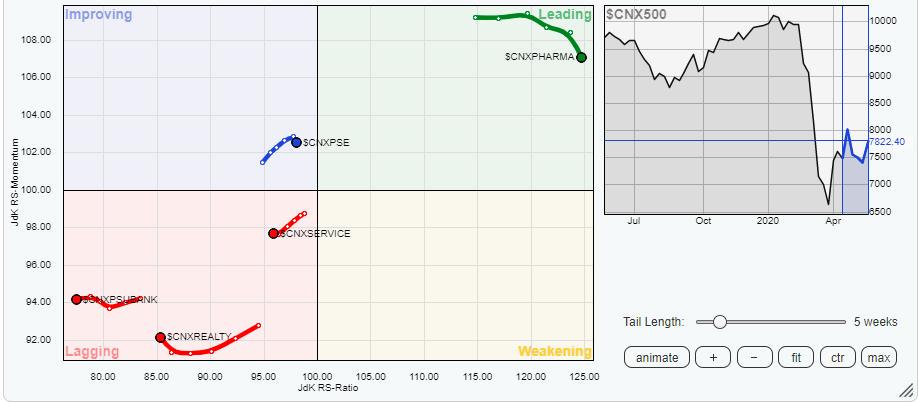
In our look at Relative Rotation Graphs®, we compared various sectors against CNX500 (NIFTY 500 Index), which represents over 95% of the free float market cap of all the stocks listed.
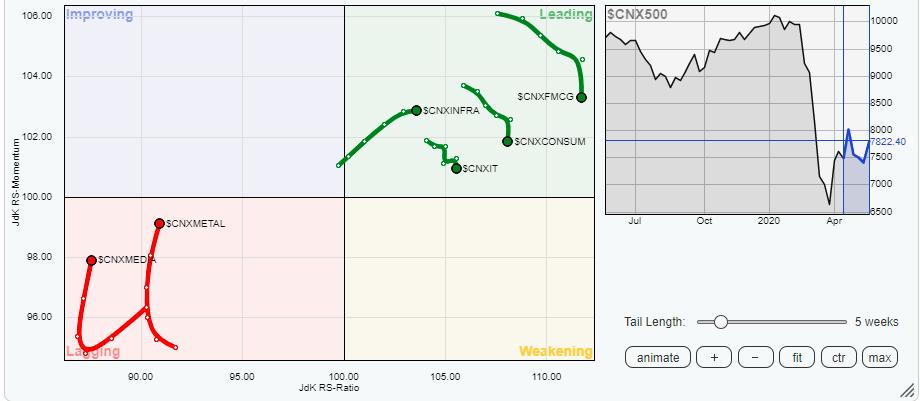
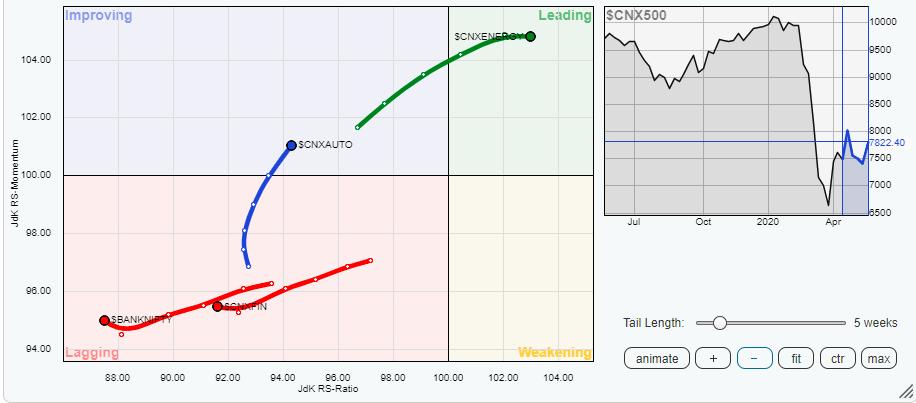
The review of Relative Rotation Graphs (RRG) shows that the IT sector, along with FMCG and Consumption, appears to be taking a breather. Despite staying in the leading quadrant, they have lost sharply on the relative momentum front. These sectors may relatively outperform the broader markets, but their contribution may be diminishing. The Energy, Pharma and Infra sectors remain firmly in the leading quadrant and will continue to outperform the broader NIFTY 500 index relatively.
Banknifty, PSU Banks, Financial Services, Realty and the Service sector indices continue to languish in the lagging quadrant. They may perform individually, but, on relative terms, they are set to grossly underperform the broader markets. The Metal and Media indexes are in the process of consolidating themselves by arresting their underperformance.
The Auto Index has advanced firmly in the improving quadrant. It has completed its bottoming out process and is likely to join the PSE and Commodities groups in bettering its performance on a relative basis against the broader markets.
Important Note: RRG™ charts show the relative strength and momentum for a group of stocks. In the above chart, they show relative performance against NIFTY500 Index (Broader Markets) and should not be used directly as buy or sell signals.
Milan Vaishnav, CMT, MSTA
Consulting Technical Analyst,


