Moving Averages are one of the most simple and age-old tools within a technician's toolkit.
This humble indicator is nothing more than a smoothing tool, used for smoothing the price data to form a trend following indicator. It does not predict price direction, just the current trend and directional move of the price. Moving averages are lagging in nature and react late as they are based on past prices.
Despite being so unassuming, they form the basis of many other important indicators, such as Bollinger Bands, MACD, etc. The most commonly used variants of the Moving Averages are the Simple Moving Average and the Exponential Moving Average. One of the simplest uses of this indicator is to determine support and resistance price levels. If the price is above any Moving Average, that MA is expected to act as a support. On the other hand, if the price is ruling below any Moving Average, that MA is expected to act as a resistance point on the upside.
Most of the time, we tend to give lesser importance to this indicator, placing more emphasis on use of other oscillators and indicators and tend to ignore this. However, this humble indicator does not fail to give out the most important indications despite the whipsaws that it often sees given its lagging nature.
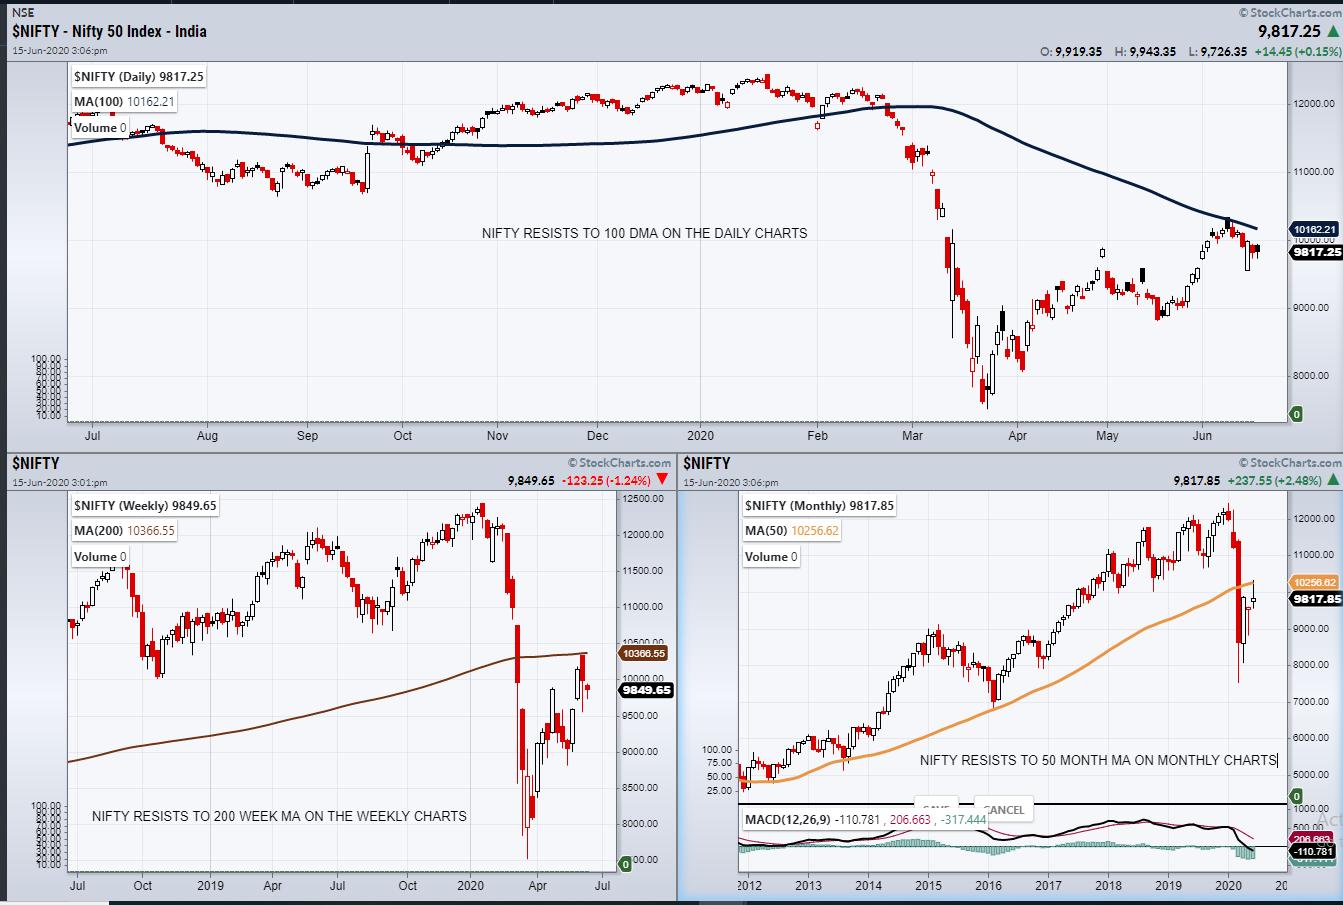
In the above chart, we have NIFTY 50 Index in three time-frames: Daily, Weekly and Monthly. Notice how, in each time frame, a different Moving Average has acted as a resistance even during such highly volatile market movements.
On the Daily Chart, the Index found resistance at the 100-day Simple Moving Average. On the weekly chart, it was the 200-week Simple Moving Average that proved to be an overhead resistance. Although the monthly bar for June is yet incomplete, as of today, the 50-month Simple Moving Average has acted as resistance.
This simple tool goes beyond this. The user-defined Moving Averages are also deployed as market breadth to determine the internal Market Strength and spot any anticipated directional move on the either side.
The use of a Moving Average on market breadth data to determine internal market strength will be discussed in our forthcoming webinar, titled "Understanding Market Breadth And Relative Strength Index For Profitable Trade Setups". Watch it this June 20, 2020.
The bottom line is that we should not ignore this humble indicator. The use of moving averages goes a long way in not only determining the trend, but also towards determining important resistance/supports and determining internal strength of the markets.
Milan Vaishnav, CMT, MSTA
Consulting Technical Analyst,


