After a strong gain of 5.86% in the week prior to this past one, the NIFTY took a breather after rising nearly 1000 points over the past couple of days following a strong liquidity gush fueled by global risk-on environment. The past couple of days stayed volatile, especially the last trading session of the week, which saw a gap down opening with the index making up for all the gains. The markets oscillated once again in a wide 784-point range; the headline index ended with a net loss of 169.25 points (-1.67%) on a weekly basis.
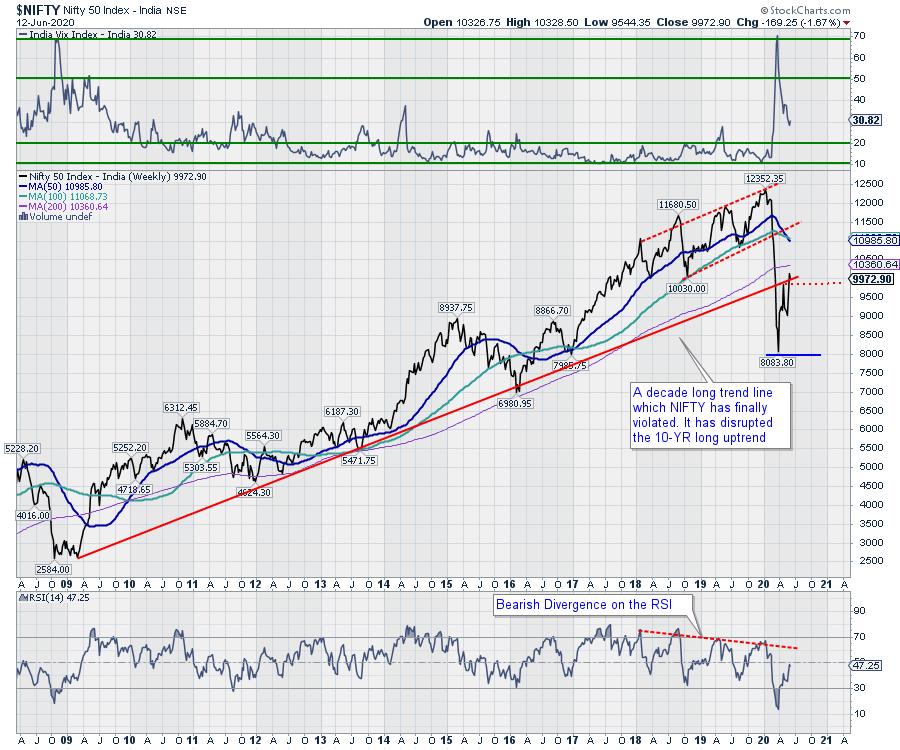
The volatility surged during the previous week. The India Volatility Index, INDIAVIX, rose by 7.47% to 30.82. On the long-term weekly charts, the NIFTY has resisted to the 200-week MA, which currently stands at 10360. This means that the 200-week MA will be extremely crucial to watch over the coming weeks; no sustainable up move shall occur until the NIFTY moves past this level and closes above this point. Volatility over the coming week is expected to rise and the trading range is expected to stay wider-than-usual over the coming days.
The coming week is expected to see a jittery start to the trade. The levels of 10090 and 10300 will act as resistance points. The supports will come in at 9830 and 9700. As mentioned, any corrective move will make the trading range wider than usual.
The weekly RSI is 47.25; it remains neutral and does not show any divergence against the price. The weekly MACD is bullish and trades above its signal line. A black body occurred on the candles; with it appearing on the wide-range candle just below the resistance point, that body reinforces the 100-Week MA as an important resistance over the near term.
The pattern analysis shows that the NIFTY has managed to marginally penetrate the decade-long rising trend line. However, it would be important to stay above that and move past important resistance point to confirm this penetration, as the internals of the markets have remained weaker than required.
The surge that we witnessed over the past couple of days should never be mistaken as a new bull market phase. What we saw was a massive short squeeze happening when the markets got oversold following the sharp declines. Also, it should be noted that bear market rallies tend to remain very sharp and equally deceptive. We reiterate approaching the markets with caution, using all future upsides less to make new purchases and more for protecting profits at higher levels, as the markets are not yet completely out of the woods. A selective approach with vigilant protection of profits at higher levels is advised for the coming week.
Sector Analysis for the Coming Week
In our look at Relative Rotation Graphs®, we compared various sectors against CNX500 (NIFTY 500 Index), which represents over 95% of the free float market cap of all the stocks listed.
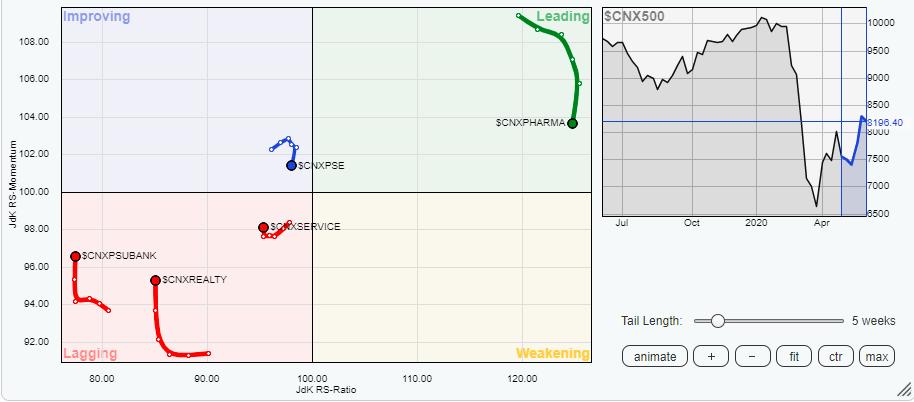
The review of Relative Rotation Graphs (RRG) presents some concerning developments. On one hand, there are few sectors that were leading appear to have topped out. On the other hand, there are a few sectors which are yet to bottom out. The Pharma Index remains in the leading quadrant along with the Energy group. However, both Indexes are heading lower while giving up on their relative momentum.
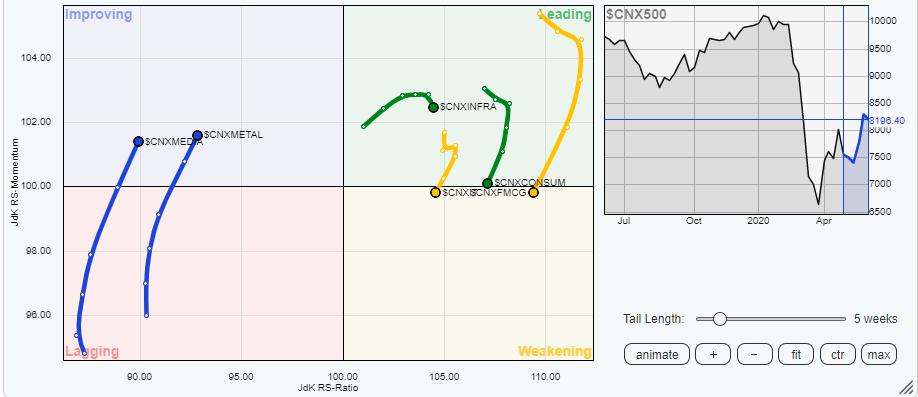
The NIFTY Consumption Index is on the verge of slipping in the weakening quadrant, whereas the IT and FMCG packs have already slipped in the weakening quadrant and appear to have topped out. The NIFTY Commodities Index has made a soft entry in the leading quadrant.
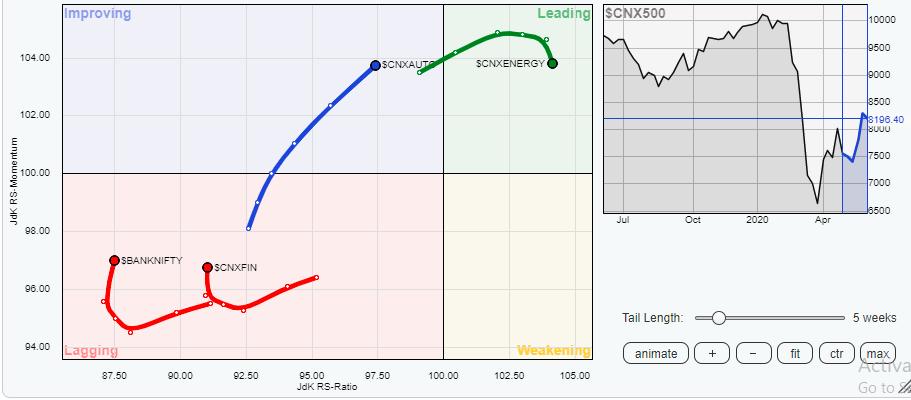
The Auto Index, along with the Media and Metal groups, is in the improving quadrant. They are heading northeast and, therefore, appear to be rotating favorably while steadily building up on their relative momentum. Metal appears to be the case of worry as it is rotating sharply back towards the lagging quadrant.
Other key Indexes like BankNifty, PSU Bank and Financial Services, Services Sector and Realty Indexes have managed to halt their declines. They are improving on the relative momentum, but still remain in the lagging quadrant and they do not appear to have bottomed out completely.
Important Note: RRG™ charts show the relative strength and momentum for a group of stocks. In the above chart, they show relative performance against NIFTY500 Index (Broader Markets) and should not be used directly as buy or sell signals.
Milan Vaishnav, CMT, MSTA
Consulting Technical Analyst,


