After taking a breather during the week before this one, the Indian equity markets moved higher again and closed the week with decent gains. The trading range remained less wide than in the previous week. The earlier week had seen the NIFTY oscillating in a 784-point wide range; this time, the Index oscillated in a 546-point range. Such wider-than-usual trading range explains the liquidity gush occurring in line with the risk-on setup seen across the global markets. While continuing to stay below the key resistance point, the headline Index ended with a net gain of 271.50 points (+2.72%) on a weekly basis.
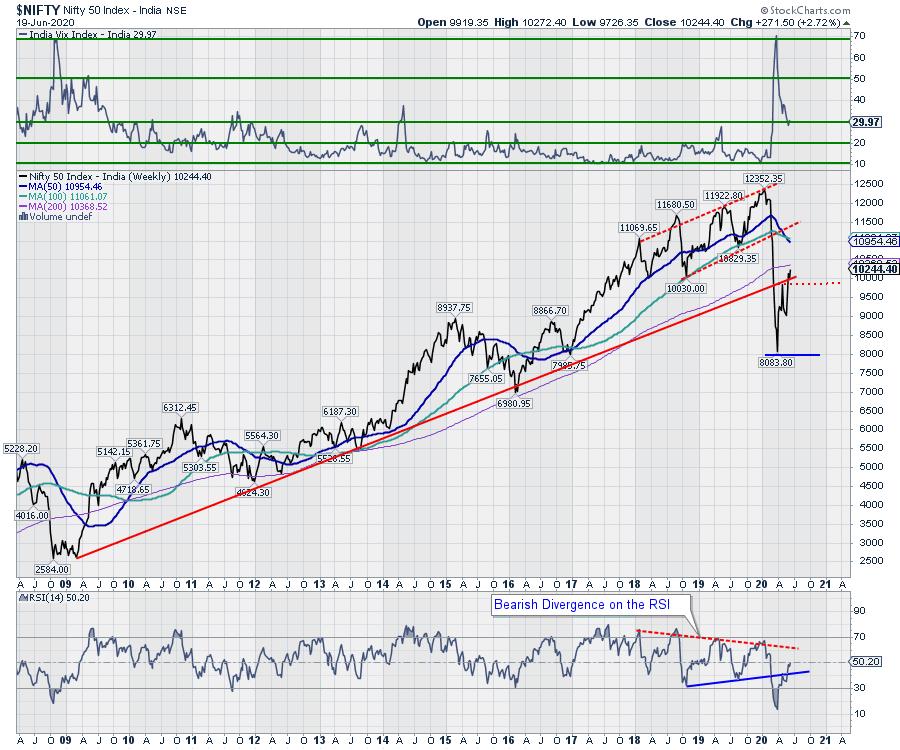
As compared to a 7.4% surge, the volatility cooled off a bit this week. The India Volatility Index, INDIAVIX, came off by 2.78% to 29.97. In the week before this one, the NIFTY had seen the 200-Week MA acting as a strong resistance point. The 200-DMA presently stands a 10368, and this level will continue to pose very stiff resistance to the markets going ahead from here. In the event of the extension of the current move, the price action of the NIFTY vis-à-vis this level will be very crucial to watch over the coming weeks.
The coming week is expected to see the levels of 10368 and 10435 acting as overhead resistance points. The supports come in relatively lower at 10135 and 9960 levels. Just like the previous week, the trading range will continue to remain wider-than-usual this time as well.
The weekly RSI is 50.20; it remains neutral and does not show any divergence against the price. This lead indicator often finds resistance in the 50-60 zones during a bear market move. Watching its level will be necessary going ahead. The weekly MACD is bullish and trades above its signal line. A white body emerged on the Candles. Apart from this, no other formations were noticed.
The pattern analysis shows that the NIFTY has managed to crawl above the decade-old upward rising trend line. In a way, this was an extraordinarily strong support that the markets breached on the downside. Given the significance of this support being breached, this was supposed to act as a very strong resistance on the way up; however, it resisted only once before the NIFTY moved past it. The NIFTY may find resistance at the 200-Week MA over the coming days in the event of continuation of the current move.
As short-term traders, they have little choice but to keep following the trend. However, given the present technical setup, chasing such wild moves on the higher side is making the risk-reward ration less favorable. However, to handle such a situation, it would be prudent to chase the momentum, but do so while trailing the stop-losses very vigilantly, as this would help protect a major portion of profits in the event of any sharp corrective move. We reiterate staying highly stock-specific and moving along with the uptrend with a great degree of caution; unabated moves on the higher side makes the setup somewhat unhealthy.
Sector Analysis for the Coming Week
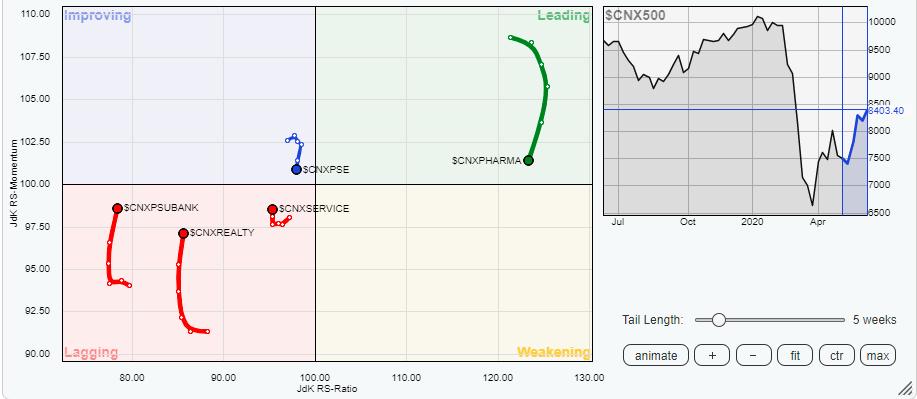
In our look at Relative Rotation Graphs®, we compared various sectors against CNX500 (NIFTY 500 Index), which represents over 95% of the free float market cap of all the stocks listed.
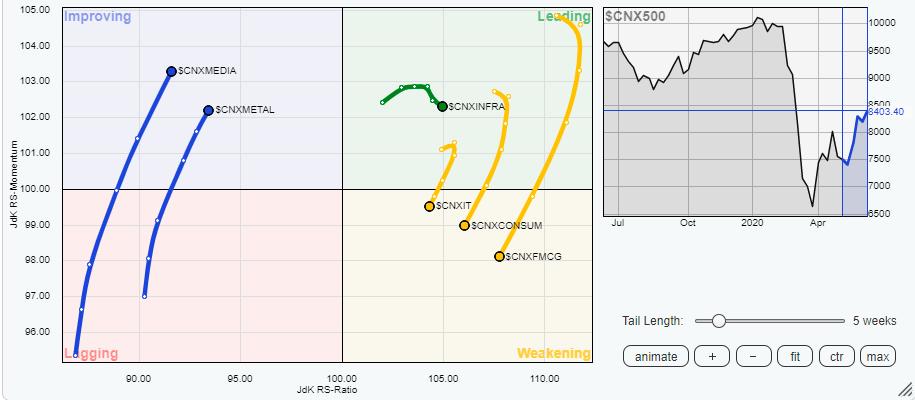
The review of Relative Rotation Graphs (RRG) shows the sectoral setup progressing on the expected lines. No untoward or sudden move in any sector is noticed. The Consumption and the IT Index, which were about to slide in the weakening quadrant, have slipped into the weakening quadrant this week. The FMCG Index has moved further down in the weakening quadrant.
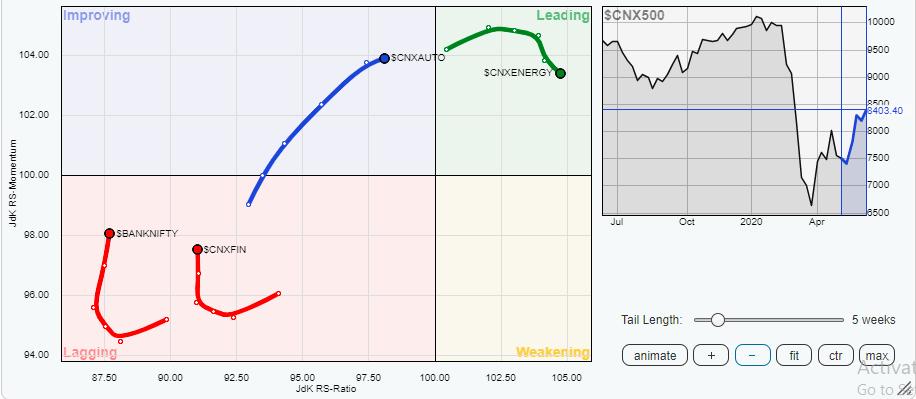
NIFTY Energy and Infrastructure remain in the leading quadrant. Along with these two groups, NIFTY Pharma and Commodities also continue to hold in the leading quadrant, though Pharma group appears to be slowing down on its relative momentum. However, these four groups will continue to relatively outperform the broader NIFTY500 Index over the coming week.
The NIFTY Media, Metal and Auto Indexes are in the improving quadrant; they are maintaining their relative momentum against the broader markets. However, the NIFTY PSE Index appears to be taking a sharp negative rotation back towards the lagging quadrant.
The BankNifty, Realty, PSU Banks, Services Sector and Financial Services groups are seen sharply improving their relative momentum. However, they still remain in the lagging quadrant and have not completed their bottoming out process.
Important Note: RRG™ charts show the relative strength and momentum for a group of stocks. In the above chart, they show relative performance against NIFTY500 Index (Broader Markets) and should not be used directly as buy or sell signals.
Milan Vaishnav, CMT, MSTA
Consulting Technical Analyst,


