In a relatively less volatile week, the Indian equities continued to surge higher amid liquidity-driven rally. After gaining 2.72% in the week before this one, the NIFTY extended its up move this week as well. The index saw range-bound movement of just 359 points over the past five session, which was much smaller compared to the previous weeks as volatility declined. Despite the ranged movements, the Index did not violate any of the key levels on the either side and closed near its key resistance point. Expiry of the June derivative series also played its part in the previous week, which dominated the moves on the higher side. Amid a less volatile environment, the headline index NIFTY ended with net gains of 138.60 points (+1.35%) on a weekly note.
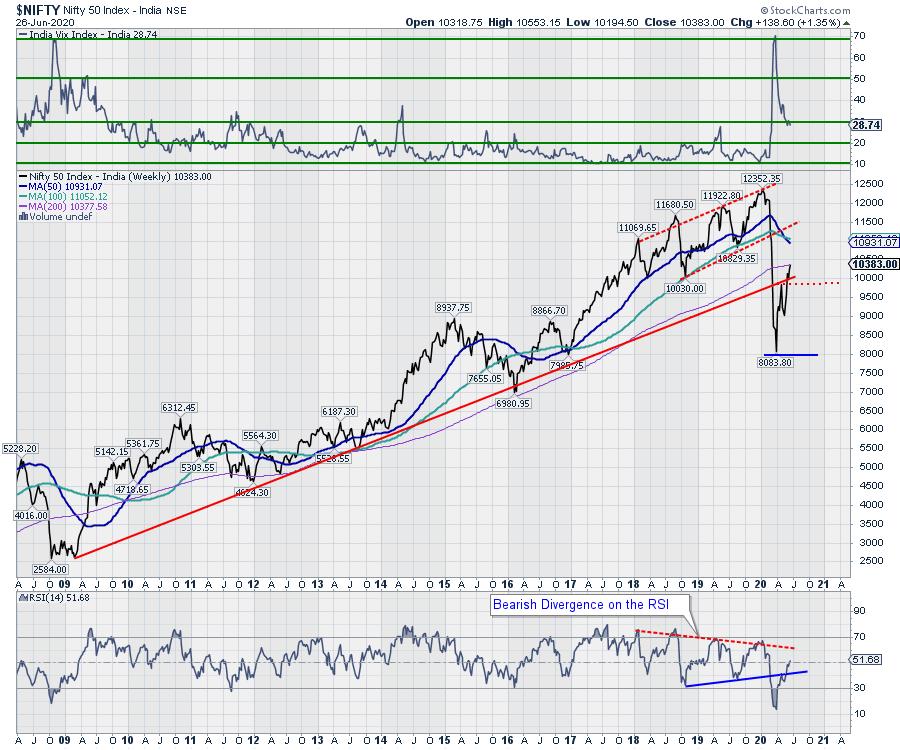
There are high chances of some capped intermittent moves on the higher side. The NIFTY Futures have closed with a steep discount of 65 points. Along with the surge in the previous session, the Futures have added a big 9.37%, or over 9.96 lakh shares, in net Open Interest. On the other hand, the NIFTY has closed just a few points above the crucial 200-Week MA, which presently stands at 10377.25. The volatility declined over the week as the India Volatility Index (INDIAVIX) came off by 4.10% to 28.74 on a weekly basis. This was the second week in a row where the volatility has declined.
The coming week will see the levels of 10550 and 10665 acting as stiff overhead resistance points. On the lower side, the supports are expected to come in at the 10285 and 10110 levels.
The weekly RSI is 51.68; it remains neutral and does not show any divergence against the price. From the patterns point of view, it is moving inside a broad channel with moderately falling tops. The weekly MACD is bullish as it trades above its signal line. A spinning top appeared on the candles. Spinning tops denote a candle with a small real body; it signifies lack of conviction among market participants and has significance if it occurs near any key resistance points. In the present case, it has emerged near the 200-week MA.
The pattern analysis shows that the NIFTY has nearly completed one of its sharpest pullbacks in its history. The current pullback has classically halted near the 200-week MA. It would be extremely crucial to observe the close levels of the coming week to see the price action of the Index against this crucial resistance point. In event of any corrective moves, the NIFTY has a support in form of a decade old rising trend line, which it had violated earlier.
The markets are presently placed at a crucially important juncture. On one hand, the F&O data for the immediate short-term suggest some likely extension of the move, or at least, strong resilient on the downside. On the other hand, closing near the 200-week MA should not be taken lightly, as the NIFTY is highly unlikely to disregard this level and move past it in the first attempt. We recommend continuing the approach the weekly cautiously unless the NIFTY either resolves this resistance point or shows some mild corrective moves going forward.
Sector Analysis for the Coming Week
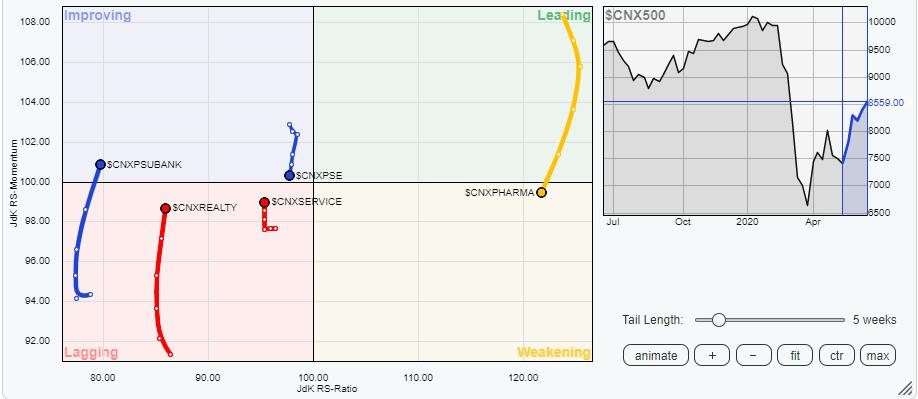
In our look at Relative Rotation Graphs®, we compared various sectors against CNX500 (NIFTY 500 Index), which represents over 95% of the free float market cap of all the stocks listed.
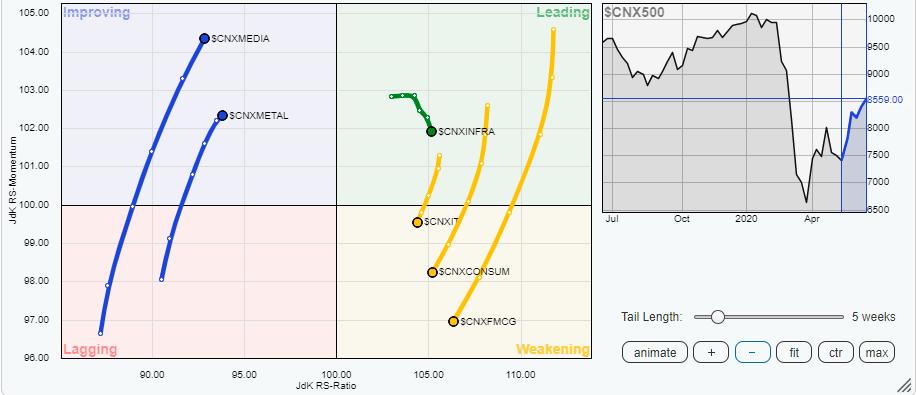
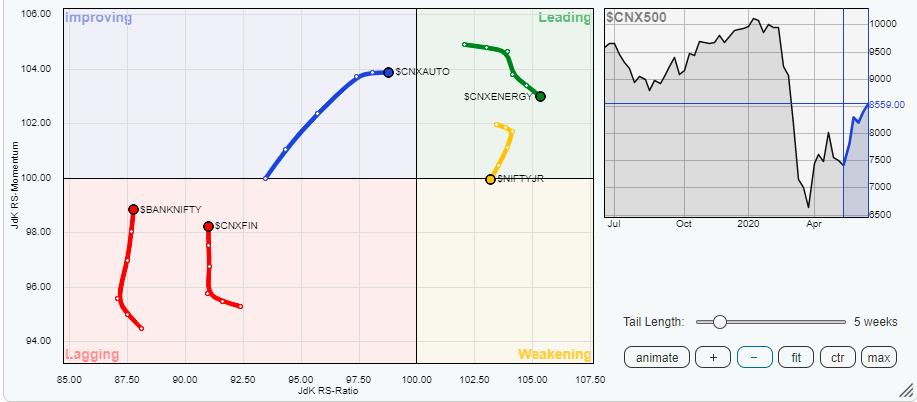
The review of Relative Rotation Graphs (RRG) shows that, while the broader sector rotation is happening on the expected lines, the sectors also continue to evidently change hands when it comes to leading the moves. NIFTY Infrastructure, Energy and Commodities remain in the leading quadrant, but they also appear to be showing some signs of tiredness. These groups will continue to relatively outperform the broader markets, but the strength and momentum may continue to diminish over the coming days.
On the other hand, NIFTY Pharma has entered the weakening quadrant and appears to have topped out. The NIFTY IT, Consumption and FMCG have further advanced in the weakening quadrant. These groups are collectively likely to underperform the broader NIFTY500 Index on relative terms.
The Media, Metal and Auto are firmly placed in the improving quadrant. They appear to be maintaining their relative momentum and are set to offer stock-specific outperformance over the coming week. The PSU Bank Index has entered the improving quadrant. Being away from the center point, this group is now set to offer much better Alpha going ahead. Apart from this, the NIFTY Realty, BankNIFTY and Services groups appear to be continuing to improve their relative momentum. The NIFTY PSE index is rotating unfavorably and is moving back towards the weakening quadrant again.
Important Note: RRG™ charts show the relative strength and momentum for a group of stocks. In the above chart, they show relative performance against the NIFTY500 Index (Broader Markets) and should not be used directly as buy or sell signals.
Milan Vaishnav, CMT, MSTA
Consulting Technical Analyst,


