The week before this one had seen the headline index testing a couple of important levels on daily and weekly timeframe charts. On the daily chart, the index had closed a notch above the 200-DMA; on the weekly chart, it had tested the 50-week MA. Over the past five session, the markets displayed a generally buoyant intent and went on to move past a few another important levels as well. In a session wherein the NIFTY oscillated in a less than 300-point range, it went on to surge higher and ended with a gain of 292.45 points (+2.68%) on a weekly note.
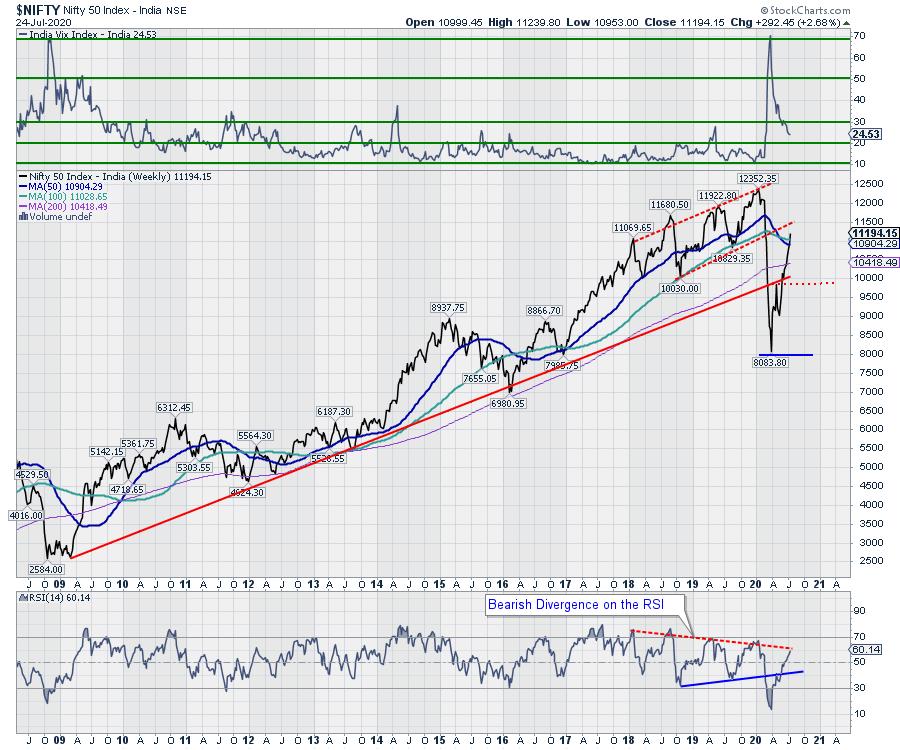
During the past five sessions, as of the week ending Friday, July 24th, the Index has not only moved well past the 200-DMA, which is presently at 10862, but it has also moved past the 50- and 100-week MAs, which stand at 10904 and 11028 respectively. Although this is now happened with tapered momentum at higher levels, the markets have not shown signs of any major weakness. The India Volatility Index, INDIAVIX, rose marginally by 1.56% to 24.53 on a weekly basis.
Monday is likely to see a tepid but quiet start to the week. The levels of 11250 and 11390 will act as resistance points. The supports will come in at the 11030 and 10945 levels.
The weekly RSI is 60.14; it has marked a fresh 14-period high, which is bullish. The RSI is neutral and does not show any divergence against the price. The weekly MACD is bullish as it trades above its signal line. A rising window occurred on the candles; this generally implies continuation of the upward trend. However, this would require confirmation on the next weekly bar.
The pattern analysis shows that the NIFTY has now not only moved inside the decade-old trend line that it had violated in the month of March, it also now trades above all its key weekly moving averages. While doing so, the index has shifted its support levels higher,
Over the coming week, since the NIFTY has been able to keep its head above the 10900 level, it may attempt to move higher incrementally. Only in the event of the index slipping below 10900 may we see some higher degree of weakness creeping in. There are higher chances of the markets facing a slightly wide-ranged consolidation as no signs of any major weakness are seen. However, despite this technical setup, we cannot ignore the overstretched nature of the markets. Because of this, the volatility rising and markets getting vulnerable at higher levels, experiencing sharp profit-taking bouts cannot be ruled out. We recommend chasing the momentum in a highly stock-specific manner while guarding profits at higher levels.
Sector Analysis for the Coming Week
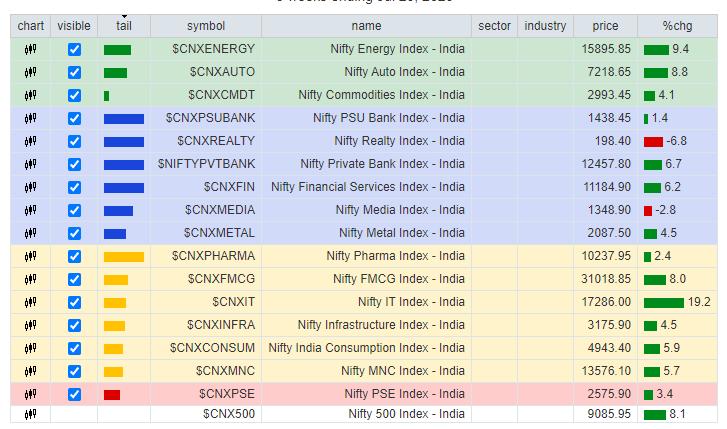
In our look at Relative Rotation Graphs®, we compared various sectors against CNX500 (NIFTY 500 Index), which represents over 95% of the free float market cap of all the stocks listed.
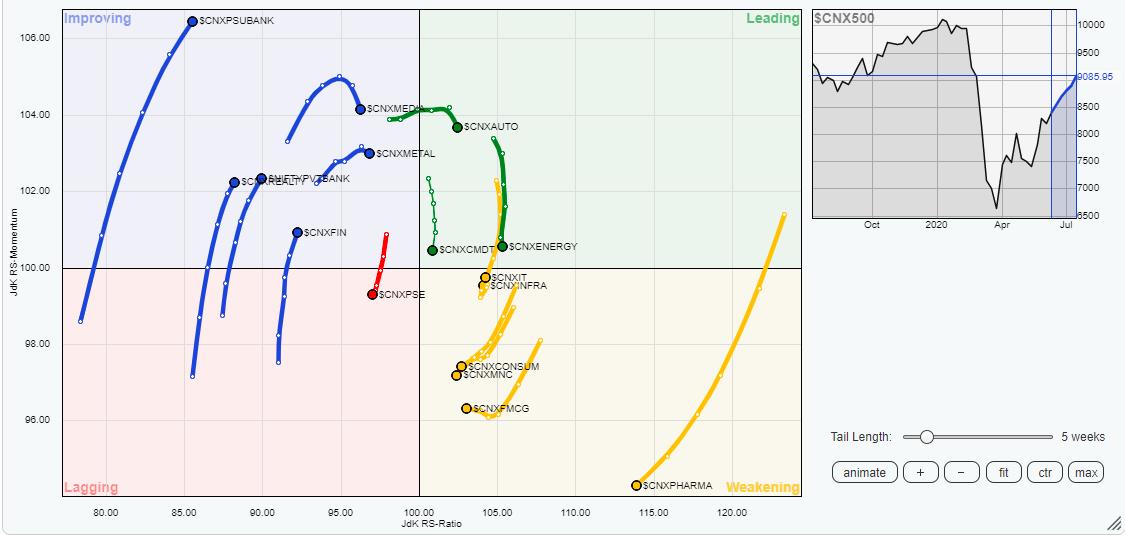
The review of Relative Rotation Graphs (RRG) shows that two sectors appear giving up momentum midway, while one sector is seen taking a U-turn towards the leading quadrant.
NIFTY Auto remains in the leading quadrant, but its momentum appears to be tapering up. The sector may relatively outperform the broader NIFTY 500 Index, but its momentum may slow down. The sectors like Nifty Energy and Commodities, which are in the leading quadrant, are seen vertically giving up on their momentum. They may not outperform the broader markets.
Apart from this, the Media and Metal packs are seen taking a breather while staying in the improving quadrant. Any relative outperformance in these groups may stay highly stock-specific. Realty, PSUBANKS, BankNifty, Services and the Financial Services pack are not only in the improving quadrant, but also seen advancing firmly while maintaining their relative momentum. These groups may pose resilient performance over the coming days.
The IT sector, which is currently in the weakening quadrant, is seen making a U-turn towards the leading quadrant. NIFTY Consumption, FMCG, Pharma, Infrastructure and PSE groups are placed in the weakening and lagging quadrants. They are rotating negatively and may relatively underperform the broader markets.
Important Note: RRG™ charts show the relative strength and momentum for a group of stocks. In the above chart, they show relative performance against NIFTY500 Index (Broader Markets) and should not be used directly as buy or sell signals.
Milan Vaishnav, CMT, MSTA
Consulting Technical Analyst,


