In the previous weekly note, we had mentioned that the markets were losing momentum in general despite some measured incremental up moves. The week that went by traded much on the anticipated lines. The trading range increased over the past couple of days as the NIFTY continued to witness selling pressure, twice at higher levels. In the last 5 days, the headline index oscillated in a 371-point range before ending with incremental gains. After measured moves, the markets displayed both the behavior, selling off from higher levels and short covering from the lower levels. The benchmark index ended with a net gain of 133.65 points (+1.24%).
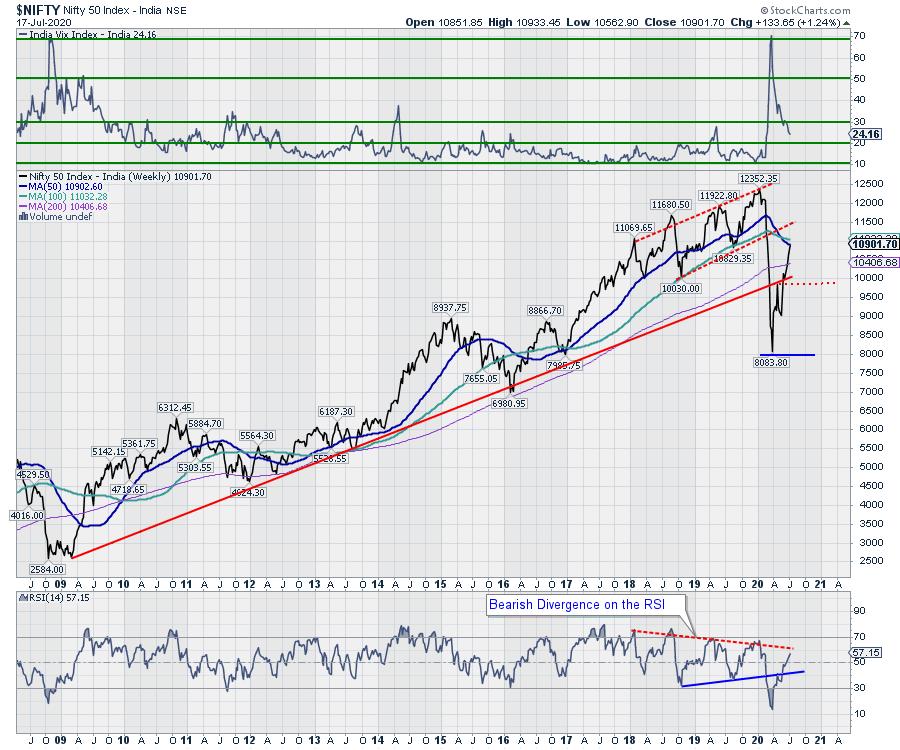
The NIFTY tested two very important levels this week. On the daily charts, it has closed slightly above the 200-DMA, which is currently at 10869. On the weekly chart, the Index tested the 50-Week MA, which is at 10902. The coming week will be extremely crucial to watch as NIFTY's behavior against these two levels will be significant on a closing basis. The volatility also declined as the INDIAVIX retraced by another 3.15% to 246.16. Despite the risk-on setup very much in play, we reiterate the need to follow the upward momentum in a most cautious manner.
The coming week is expected to see the levels of 10960 and 11065 as overhead resistance points. The supports come in lower at 10810 and 10635 levels. Any corrective move will make the trading range wider over the coming days.
The weekly RSI is 57.15; it has marked a fresh 14-period high, which is bullish. The RSI is neutral as it does not show any divergence against the price over the 14-day period. However, it remains within a range and a broad pattern formation. The weekly MACD is bullish as it trades above the signal line.
A Hanging Man occurred on the Candles. This formation remains important as it has appeared at the 50-Week MA and just below the 100-week MA resistance point. Even with the liquidity-driven push on the upside, this formation certainly calls for caution at the current levels.
The pattern analysis shows that the NIFTY, while continuing its pullback from the lows seen in March, has not only penetrated the decade-old trend line, but it has also moved past the 200-week MA, which remains its near-term support. On the upper side, it has just closed at the 50-week MA which is at 10902 and just below the 100-week MA which is at 11032.
Over the coming week, the price action of the NIFTY against the zone of 10850-10900 zone will be crucial. If the NIFTY is able to keep its head above this zone, then we may see some extension of the rally towards the 100-week MA. However, at all points in time, the NIFTY will continue to stay very vulnerable to sharp, but range-bound, consolidation at current levels, and this may also include some measured corrective moves in the markets. As a trader, one has to keep following the trend, but in the present technical setup, we not only recommend treading the road ahead cautiously, but also vigilantly trailing the stops and protecting profits at higher levels.
In our look at Relative Rotation Graphs®, we compared various sectors against CNX500 (NIFTY 500 Index), which represents over 95% of the free float market cap of all the stocks listed.
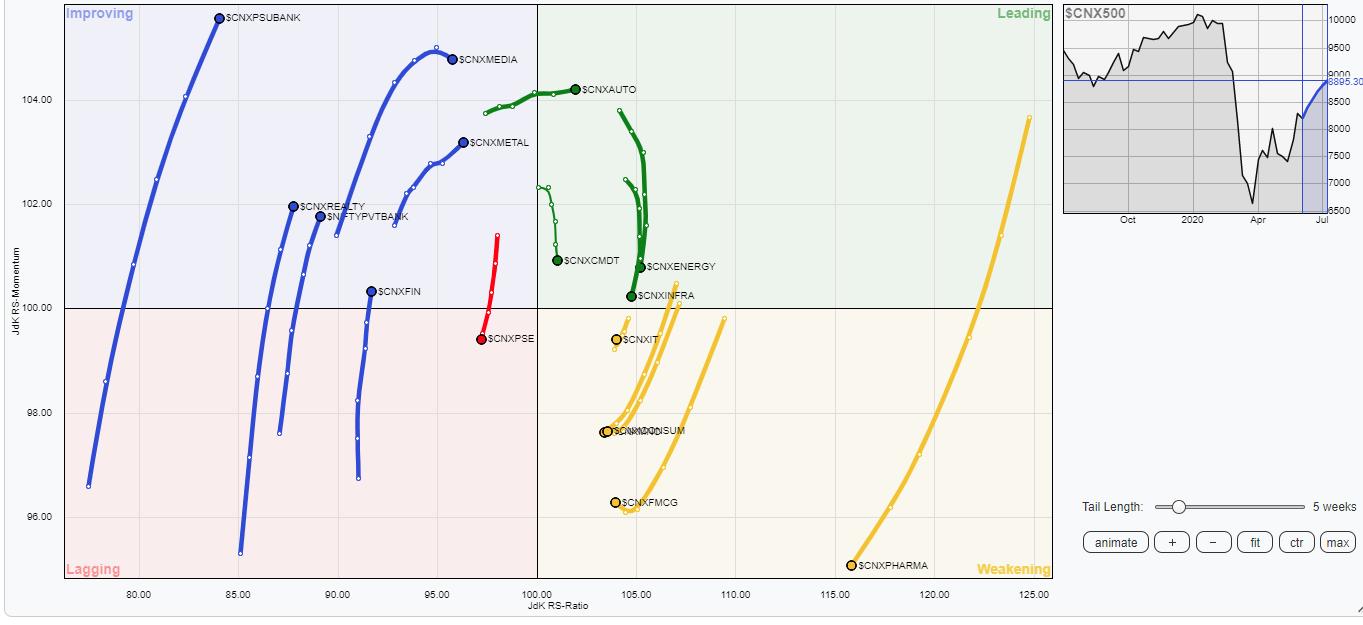
The review of Relative Rotation Graphs (RRG) shows the markets completely divided in terms of leadership, which is seen shifting from one group of sectors to the other.
The Financials, including the BankNifty, PSU Banks, Realty, Private Banks, Financial Services, Metals and Media, are all placed in the Improving quadrant. These groups are seen sharply improving on their relative momentum, which indicates likely resilient performances from these sectors over the coming days. Out of these, the Financial Services group has just crawled inside the improving quadrant, indicating that it is likely bottoming out. Along with this, the Auto index is the only Index which is placed comfortably in the leading quadrant, indicating a cumulative relative outperformance from these groups.
The Commodities Index, Energy, and Infrastructure index are also in the leading quadrant. However, they are seen sharply giving up on their relative momentum. This means that there might be some sporadic outperformance from these groups, but, overall, they may be giving up on their leadership.
The IT, Pharma, FMCG and Consumption groups are seen advancing southward in the weakening quadrant. The PSE Index has made a negative rotation to the lagging quadrant from the improving one. These groups will relatively underperform the broader NIFTY500 index collectively over the coming days.
Important Note: RRG™ charts show the relative strength and momentum for a group of stocks. In the above chart, they show relative performance against NIFTY500 Index (Broader Markets) and should not be used directly as buy or sell signals.
Milan Vaishnav, CMT, MSTA
Consulting Technical Analyst,


