The NIFTY continued its surge for the third week in a row as it extended its gains. In the previous weekly note, we had mentioned the possibilities of the mild extension of the up move. In the week that went by, the NIFTY saw itself oscillating in a slightly expanded range. The trading range for the Index remained around 400-odd points and, in the process, it also moved past some key levels. Following moves that remained in a defined and measured range, the headline index ended with a net gain of 22.35 points (+2.16%).
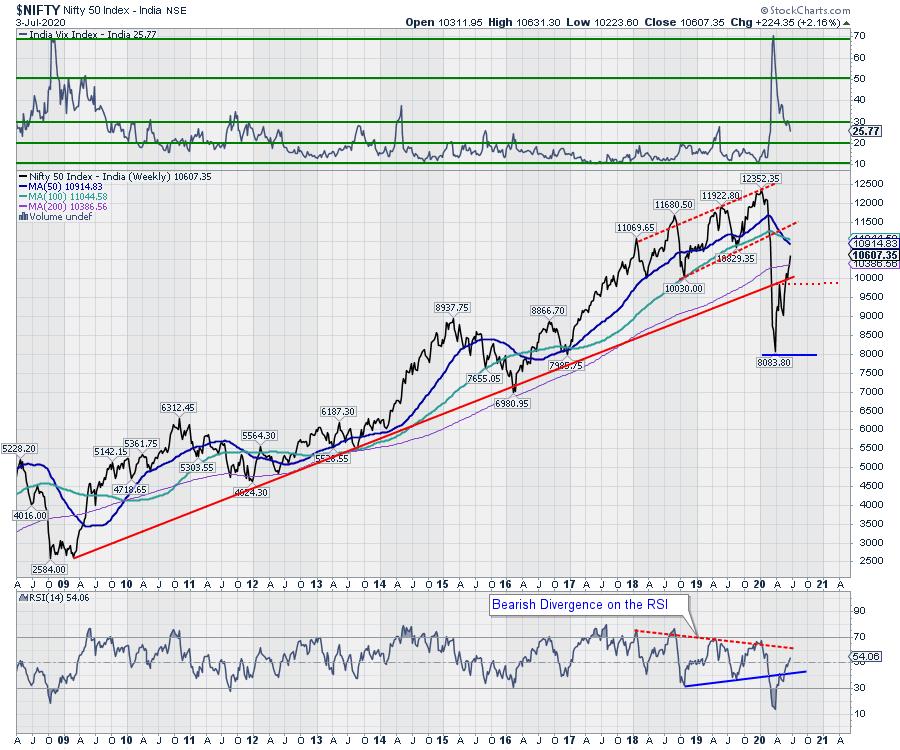
Despite an evident disconnect with the macro-economic landscape, the equity markets around the globe are being fueled by massive liquidity gush, which has resulted in a giant short squeeze amid a risk-on setup. The volatility continued its consistent decline, while the India Volatility Index, INDIAVIX, declined by another 10.33% to 25.77. The earlier week had seen the INDIAVIX coming off by over 4%. As of today, the NIFTY rests at a point which is the confluence area of one of its two strong pattern resistance points.
With the US Markets shut on Friday, the start of the week will be devoid of any global cues. The coming week is expected to see the levels of 10645 and 10775 as probable resistance points. The supports come in much lower, at 10465 and 10330. In event of any corrective activity or retracement, the range on the lower side is expected to get wider.
The weekly RSI stands at 54.06; it has marked a fresh 14-period high, which is bullish. The RSI, however, continues to remain neutral and does not show any divergence against the price. The daily MACD is bullish as it trades above its signal line. A white body emerged on the candles; apart from this, no other significant formations were observed.
The pattern analysis shows that the NIFTY has managed to move past the 200-DMA, which presently stands at 10386. The index has also crawled above the decade-old rising trend line which it had violated on its way down. This zone may act as a temporary support in the event of any retracement or any corrective move.
All in all, the markets are continuing to mark an extended up move and, in the event of this happening over the coming week as well, we recommend not chasing the up moves blindly. On the short-term daily charts, the NIFTY is at a confluence of two resistance points and showing signs of diminishing momentum. However, the liquidity-driven markets make downsides extremely resilient. In the present technical setup, we strongly recommend avoiding any major exposure and adopting a highly selective and stock-specific approach towards the markets.
Sector Analysis for the Coming Week
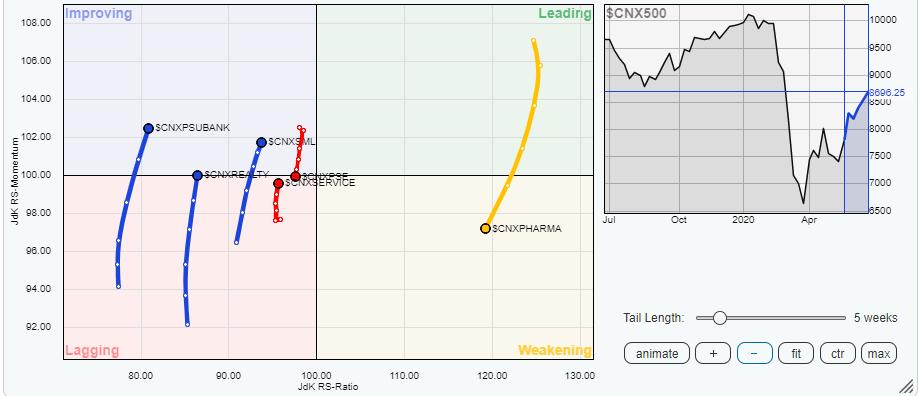
In our look at Relative Rotation Graphs®, we compared various sectors against CNX500 (NIFTY 500 Index), which represents over 95% of the free float market cap of all the stocks listed.
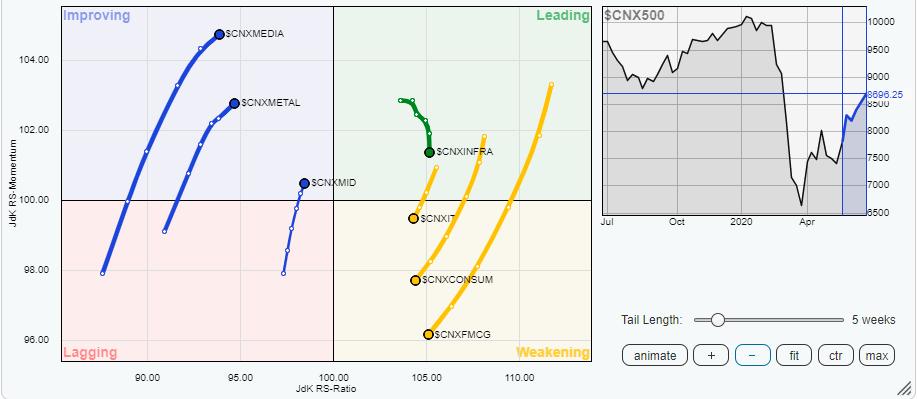
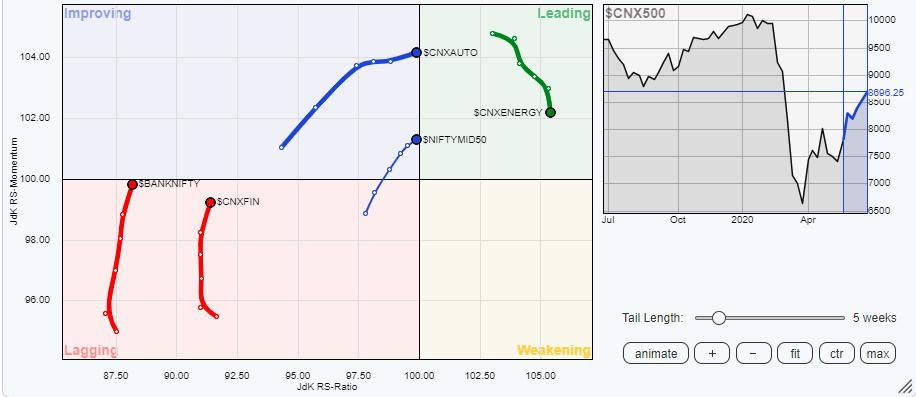
The review of Relative Rotation Graphs (RRG) shows that the sectors have continued to advance and rotate on the expected lines without any deviation in their respective trajectories. The Auto index has crawled in the leading quadrant, advancing its trajectory from the improving quadrant. The index is now set to relatively outperform the broader NIFTY 500 Index. Along with the Auto, the Infrastructure, Energy and Commodity groups are also in the leading quadrant, but they appear to be faltering on their relative momentum.
The Pharma index has slipped further in the weakening quadrant and appears to be rotating in a southwest trajectory. This index will now visibly start underperforming the broader markets. Along with the Pharma, the FMCG, Consumption and IT are also rotating on a very similar lines in the weakening quadrant.
The financial stocks are making strong rotation on the upside. While the PSU Bank Index has been making strong moves inside the improving quadrant, the BankNifty and Financial Services index are also making a near-vertical improvement in relative momentum and are moving towards entering the improving quadrant. These groups will have stock-specific outperformance against the broader markets; any major shorts should be avoided in these areas. The Realty index is also seen making a similar rotation towards the improving quadrant.
Important Note: RRG™ charts show the relative strength and momentum for a group of stocks. In the above chart, they show relative performance against the NIFTY500 Index (Broader Markets) and should not be used directly as buy or sell signals.
Milan Vaishnav, CMT, MSTA
Consulting Technical Analyst,


