After clocking robust gains in July, the NIFTY started off the first week of August on a positive note. Over the past five sessions, the markets traded in a 374-point range before closing the week with modest gains. The NIFTY stayed above its critical levels on both the daily and the weekly timeframe charts. Despite staying prone to profit taking bouts at higher levels, the index did not make definite moves on the either side. After oscillating in a bit wider range than the earlier week, the NIFTY ended with net gains of 140.60 points (1.27%) on a weekly note.
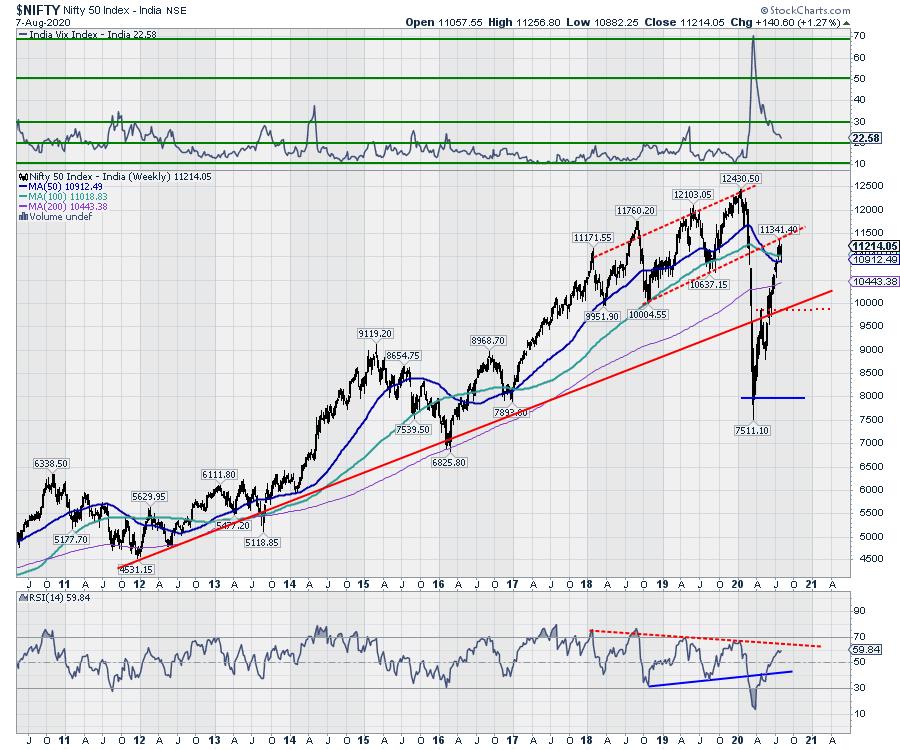
The market has continued to pile on incremental gains. However, this time, it has made a lower top and a lower bottom on the weekly charts. The NIFTY has managed to keep its head above its key 50- and 100-Week MAs, which currently stand at 10912 and 11018 respectively. The volatility also continued to decline as the INDIAVIX came off by 6.68% to 22.58. The zone between 11000 and 10900 is a very crucial one for the NIFTY as it represents important supports. On the higher side, the Index resists to the trendline that it violated earlier when it came down.
The coming week will see a tentative start to the week with resisted upsides. The levels of 11290 and 11350 will act as strong resistance points. The supports will come in at 11000 and 10910.
The weekly RSI is 59.84; it remains neutral and does not show any divergence against the price. The weekly MACD is bullish as it trades above the signal line. A white body was formed on the candles; apart from this, no other important formation was seen.
When the Index came off from its highs, it violated a channel formed over the past twelve months. Presently, the NIFTY has resisted twice just below the lower trend line of that channel. That lower trend line was a support when the NIFTY was above that line, but that trend line is now expected to act as resistance. This makes the 11300-1400 zone a strong resistance zone for the markets.
There are no signs that may point towards any serious correction in the markets. However, that being said, the NIFTY appears overstretched on the short-term charts, which may force the markets into some consolidation. This means that, though we may not expect any serious corrective moves, any runaway up moves are also not likely. So long as the NIFTY is below the 11300-11400 zone, up moves, if any, will continue to find resistance, making the markets in general vulnerable to profit-taking bouts.
We recommend approaching the markets on a very selective note and avoid major exposures unless there are some consolidation moves, which will make the current vertical move healthier. The market breadth over the past couple of days has not remained as strong as it should be, which remains a concern for the near term.
Sector Analysis for the Coming Week
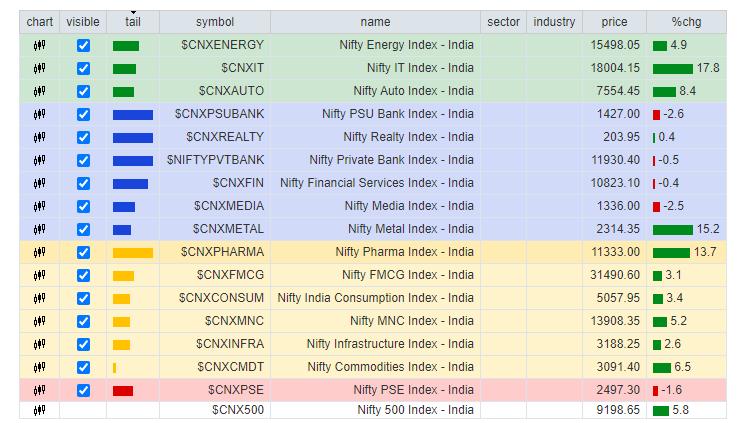
In our look at Relative Rotation Graphs®, we compared various sectors against CNX500 (NIFTY 500 Index), which represents over 95% of the free float market cap of all the stocks listed.
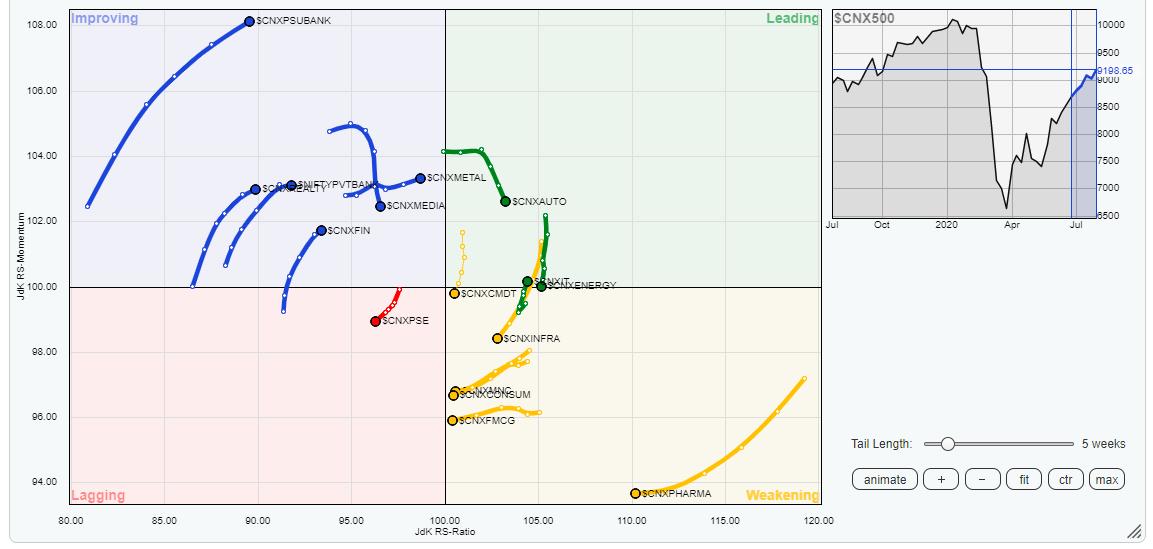
The review of Relative Rotation Graphs (RRG) shows some sectors which one should rather avoid from being invested in, despite their individual good performance.
The NIFTY Energy is about to crawl inside the weakening quadrant. The NIFTY Commodities group has already entered the weakening quadrant. The Infrastructure, PSE, FMCG and Consumption are rotating negatively while being placed in the weakening/lagging quadrants. These groups may offer some stock-specific good performance, but are unlikely to put up a great show on a collective note.
The IT group has made a strong rotating back inside the leading quadrant. The Auto Index remains in the leading quadrant as well. These two groups are likely to outperform the broader markets relatively.
Apart from this, the NIFTY Realty, BankNifty, PSU Banks Services and Financial Services groups are placed comfortably in the improving quadrant and appear to be rotating in a north-easterly direction while maintaining their relative momentum. They are set to offer a resilient show along with the IT and Auto pack.
Important Note: RRG™ charts show the relative strength and momentum for a group of stocks. In the above chart, they show relative performance against NIFTY500 Index (Broader Markets) and should not be used directly as buy or sell signals.
Milan Vaishnav, CMT, MSTA
Consulting Technical Analyst,


