After taking a breather in the week prior, this week the markets resumed their move higher and posted some incremental gains once again. Over past five days, the NIFTY has experienced range-bound oscillations, with the range still being close to its normal trading width. At the same time, the Index also resisted at a few crucial levels on both daily and weekly timeframe charts. After moving in a 350-point-wide trading range, the headline index ended with a net weekly gain of 193.20 points (+1.73%).
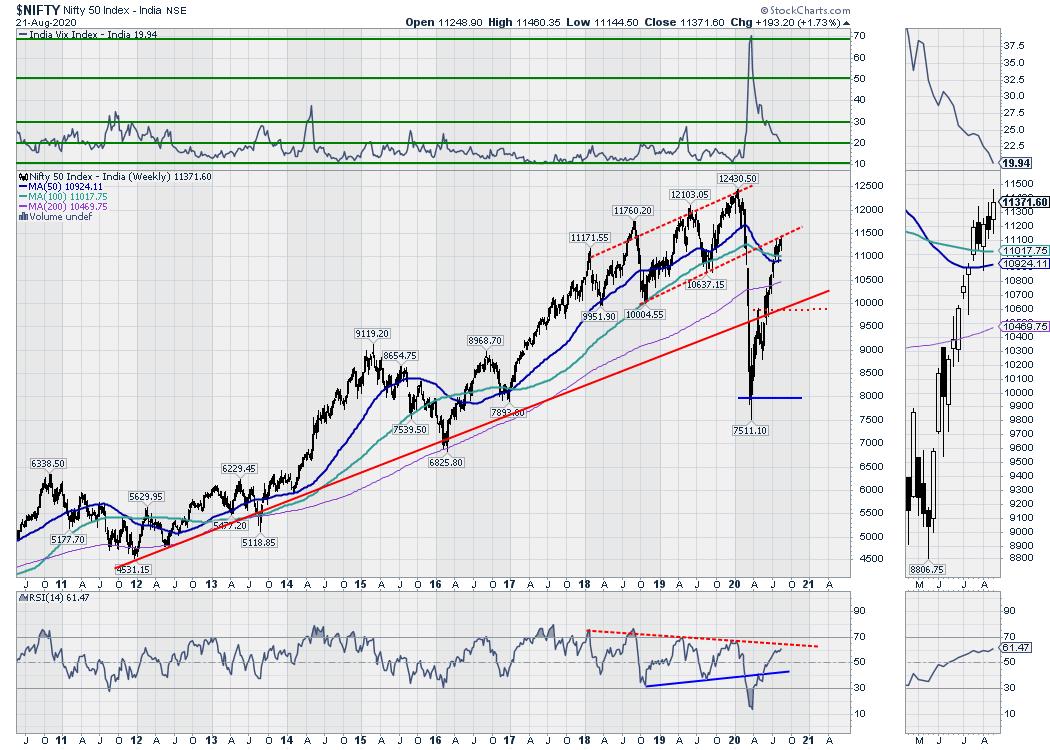
As we approach the coming week, we need to take a note of a few important points and levels and should navigate the next few days keeping them in the mind. On the daily time frame, the NIFTY has yet to navigate and fill the 11430-11500 gap that was created at the time of beginning of the decline. Also, the previous week's high of 11460 is where the NIFTY resisted to the lower trend line of the channel that it broke, which makes the 11430-11500 zone very crucial over the coming days. Also, volatility continued its decline, with INDIAVIX dipping further by 8.01% to 19.94 taking it to its lowest levels in the recent past.
Amid such a technical setup, we expect the levels of 11460 and 11595 to act as immediate resistance points. The supports will come in at the 11280 and 11135 levels.
The weekly Relative Strength Index (RSI) is at 61.47; it has marked a fresh 14-period high, which is bullish. RSI, however, also remains neutral and does not show any divergence against the price. The weekly MACD is bullish and trading above its signal line. However, the slope of the Histogram shows deceleration in the momentum. No significant formation was noticed on the Candles.
This time, a pattern analysis across both the timeframe would be required, as the current levels are important on daily as well as the weekly charts. On the weekly charts, the Index has resisted to the lower trend line of the channel that the NIFTY violated while starting to decline. On the shorter daily timeframe, the 11430-11500 zone also represents the gap that was created during the same time period.
On the technical front, a technical rebound in the US Dollar Index and the NIFTY reacting to the critical zone of 11430-11500 are the two important factors that would affect the way we approach the markets. The Midcap universe has started to outperform the frontline index over the past couple of days. This indicates that not only will the mid-caps continue fare better than the index stocks on relative terms, but it also points toward the likely possibility of the benchmark Indexes taking a breather. We recommend following the up moves if they continue while strictly guarding profits at present and higher levels, as sharply falling volatility also remains a concerning factor.
Sector Analysis for the Coming Week
In our look at Relative Rotation Graphs®, we compared various sectors against CNX500 (NIFTY 500 Index), which represents over 95% of the free float market cap of all the stocks listed.
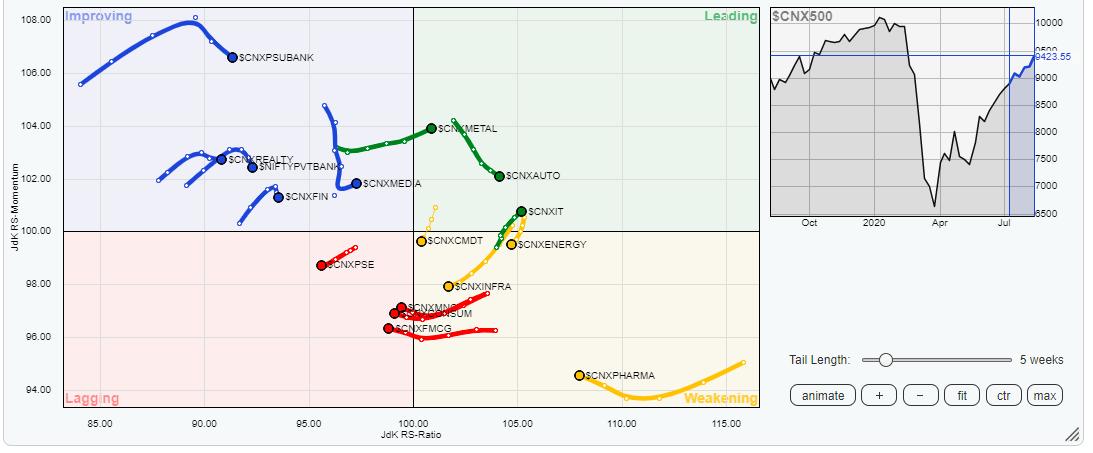
This review of Relative Rotation Graphs (RRG) shows high chances of the bulk of outperformance coming in from the broader markets.
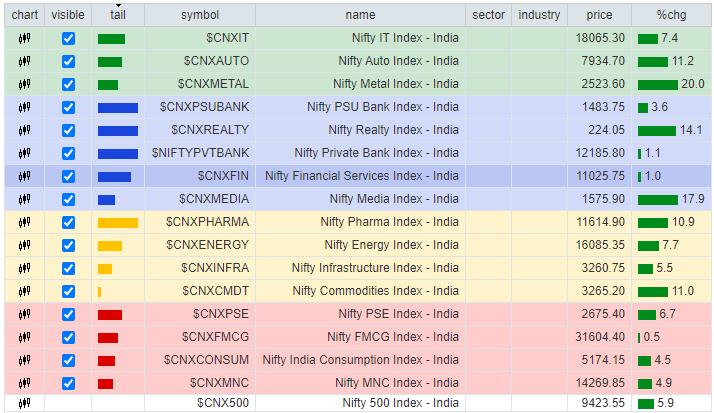
NIFTY Metal Index has moved inside the leading quadrant and is firmly placed to relatively outperform the broader NIFTY 500 index over the coming week. Along with that, NIFTY Auto and IT groups are also in the leading quadrant. Importantly, the Small-Cap Index, along with the other broader indexes, has moved in the leading quadrant. The NIFTY MidCap 100 index is also rotating in a northeasterly direction while presently positioned in the improving quadrant. These groups are likely to outperform the broader markets on a relative basis.
Other groups that are likely to put in a resilient show are the BankNifty, PSU Banks, Media and Realty groups as they are positioned in the improving quadrant.
NIFTY Energy continues to slip southward in the weakening quadrant along with the Infrastructure group. NIFTY FMCG and Consumption packs are also drifting down further in the lagging quadrant. Apart from any sporadic stock-specific show, no overperformance is expected from these groups on relative terms.
Important Note: RRG™ charts show the relative strength and momentum for a group of stocks. In the above chart, they show relative performance against the NIFTY500 Index (Broader Markets) and should not be used directly as buy or sell signals.
Milan Vaishnav, CMT, MSTA
Consulting Technical Analyst,


