This was a week when the markets perfectly respected the technical levels; they took a breather and ended with a minor loss. Over the past five days, the NIFTY piled up incremental gains, but the last trading day reversed all those little gains. The NIFTY oscillated in a narrow 262-point range but went nowhere in a meaningful way. While maintaining critical levels, the markets broadly consolidated. After moves within a defined range, the headline index finally ended with a nominal loss of 35.55 points (-0.32%) on a weekly basis.
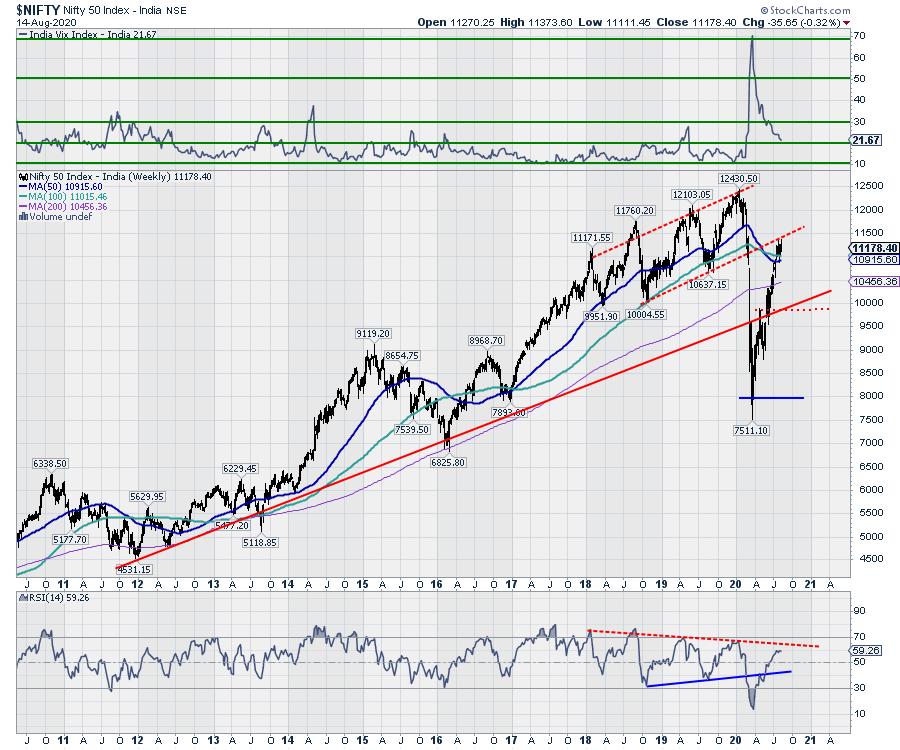
In the previous weekly note, we had mentioned that the NIFTY was piling up incremental gains but lacking the strength it requires. This was evident as the Index finally gave up after failing to penetrate the 11300-11350 zone. These levels represent a strong patten resistance in form of a trend line that the NIFTY originally broke before starting its downward spiral earlier. Consistently falling volatility also stays a concerning factor as it stands for rising complacency of market participants. INDIAVIX came off by another 4.01% to 21.67. NIFTY stays above its key 50- and 100-Week Moving Averages.
NIFTY remains one of the relatively resilient markets if compared against global peers. However, the US Dollar, which is oversold and showing bullish divergence on the lead indicators may slightly hamper the moves on the upside of the global equities in general and that of emerging markets in particular in the event of it staging a technical pullback.
The coming week will see the levels of 11280 and 11400 acting as strong overhead resistance points. The supports will come in at the 11065 and 10900 levels.
The weekly RSI is 59.26; it is neutral and does not show any divergence against the price. The weekly MACD is bullish and trades above its signal line. However, the slope of the histogram shows that the incremental momentum is tapered off and the slope is slightly declining. Apart from a black body, no significant formations were observed on the candles.
The pattern analysis shows NIFTY resisting to the lower trend line of the channel that it initially broke. It has managed to keep its head above the 50-week and 100-week MAs, which are at 10915 and 11015 respectively. This zone of 11015-10915 represents an important support area for the markets.
All in all, over the coming days, it would be of paramount importance for the NIFTY to keep its head above the 10915-11015 zone. This 100-point area represents a strong support; any breach of these levels will bring in incremental weakness in the markets. It is also important to note that any technical pullback in the Dollar Index will affect the global equity markets and India as well, even if we perform relatively better than the global peers.
We recommend avoiding aggressive bets on either side and stay light on overall exposure. A cautious approach is needed for the coming week as a technical pullback in Dollar Index and persistently low level of VIX remain a concern for the markets.
Sector Analysis for the Coming Week
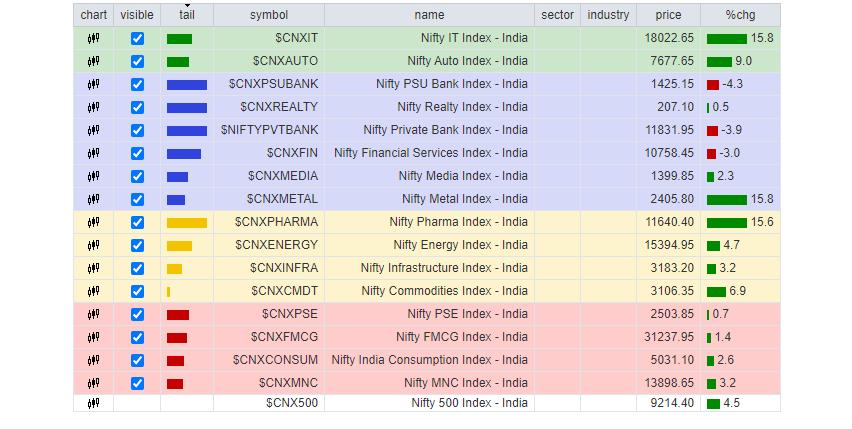
In our look at Relative Rotation Graphs®, we compared various sectors against CNX500 (NIFTY 500 Index), which represents over 95% of the free float market cap of all the stocks listed.
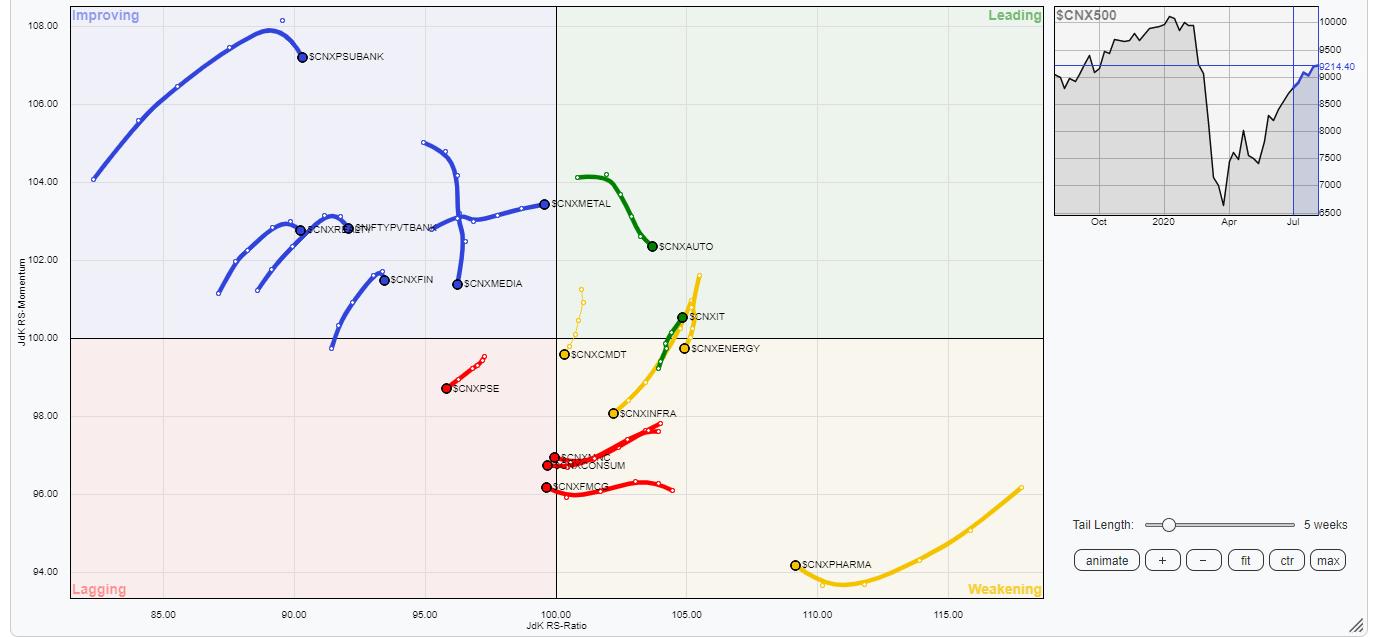
The review of Relative Rotation Graphs (RRG) shows a lack of dominant position of any sector this week.
NIFTY Auto and NIFTY IT are the only groups that are present in the leading quadrant. Out of these two, AUTO is seen giving up slowly on the relative momentum front.
Apart from this, the NIFTY Services, Financial Services, PSUBanks and BankNIFTY groups are placed in the improving quadrant. They are expected to put up a relatively better show and demonstrate resilience to any corrective moves in the markets. However, they appear to be taking something of a breather. That said, these groups are likely to relatively outperform the broader markets along with the Auto and IT Packs.
NIFTY Commodities and Energy have drifted in the weakening quadrant, joining NIFTY Pharma and NIFTY Infrastructure. Some isolated stock-specific show can be expected from these groups.
NIFTY PSE is rotating inside the lagging quadrant. NIFTY FMCG and Consumption Indexes have also entered the lagging quadrant. These groups may relatively underperform the broader markets.
Important Note: RRG™ charts show the relative strength and momentum for a group of stocks. In the above chart, they show relative performance against NIFTY 500 Index (Broader Markets) and should not be used directly as buy or sell signals.
Milan Vaishnav, CMT, MSTA
Consulting Technical Analyst,


