The week that went by remained firmly on the expected lines. In the previous weekly note, we had mentioned that the markets may push themselves higher amid increased volatility. The NIFTY indeed closed higher following a strong move, while the volatility also spiked. The financial stocks were expected to perform and it turned out exactly that way. The trading range for the week remained broad as the index oscillated in an over-480-point range before ending with net weekly gains of 497.25 points (+4.36%).
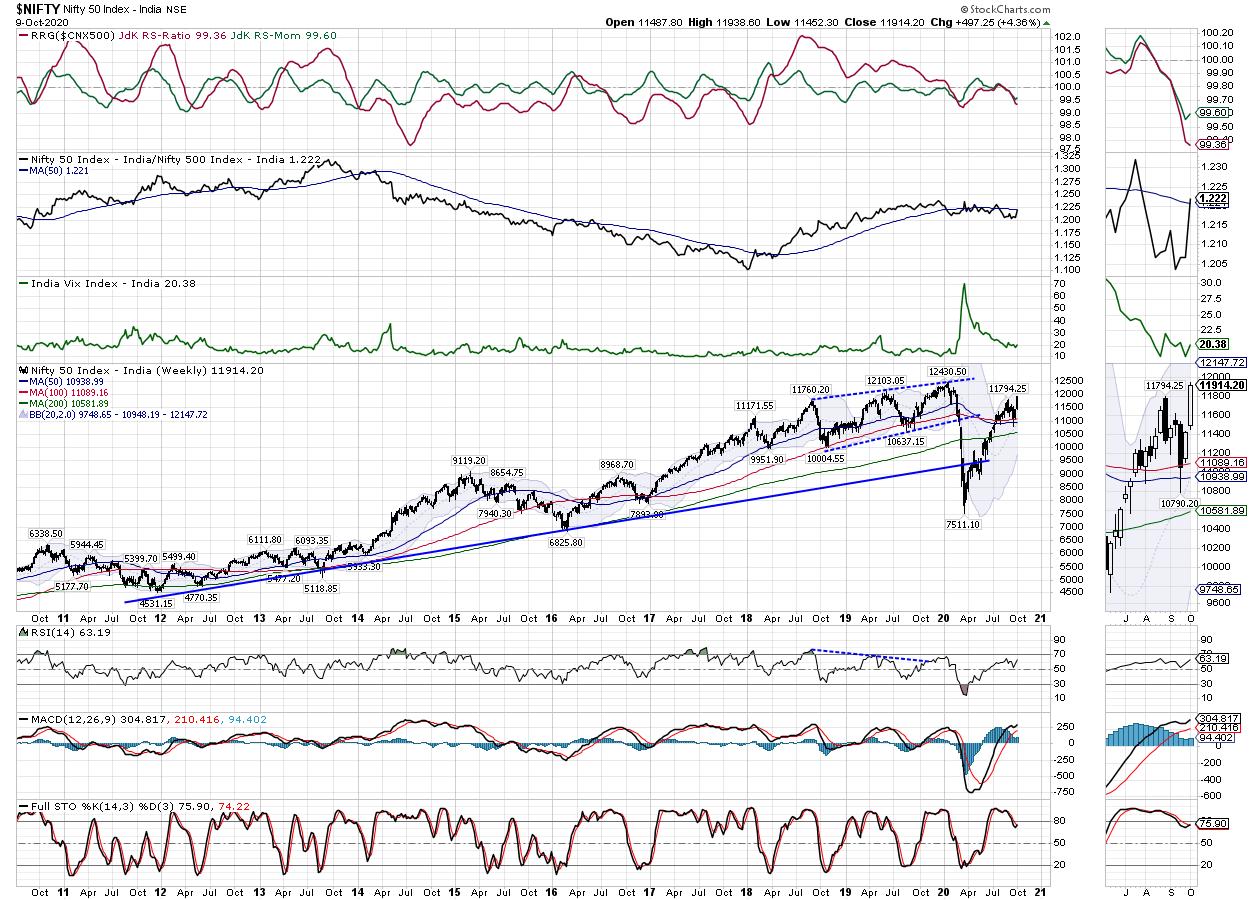
The most notable activity in the markets during the previous week is the performance of the financial stocks, as they indicate a strong presence of the risk-on setup. With the current weekly close, the NIFTY has dragged its supports significantly higher and has held the support zone of 50-Week MA and 100-Week MA, reinforcing the credibility of this zone as a strong support. The volatility also spiked on the expected lines; INDIAVIX surged by 11.06% to 20.38 on a weekly basis.
The weekly charts seem firmly poised; the markets are overstretched on the short-term time frame. Monday may see a stable start to the week. The levels of 12000 and 12165 may act as resistance points; supports will come in at 11810 and 11730. In the event of any corrective move, the trading range may get wider than usual.
The weekly RSI is 63.19; the RSI has shown a bearish divergence against the price. This bearish divergence has occurred as the price formed a 14-period high while the RSI did not. The weekly MACD is bullish as it trades above the signal line. A white body occurred; this shows the bullish consensus on the upside that prevailed during the week.
The pattern analysis of the weekly charts throws interesting perspective. With the current close, the NIFTY is back inside the channel that it had violated in March. This means that in the event of any corrective retracement, we can expect the index to seek supports at that level. In the immediate short term, the zone of 11090-10940 made up of 100- and 50-Week MA is the most crucial support zone that we will have to keep in mind going ahead.
All an all, with the risk-on setup still remaining firmly in place, we may see NIFTY attempting some more upsides. However, with each up move now, the risk-reward is getting unfavorably skewed as the NIFTY stays grossly overstretched on the short-term time frame charts. We recommend approaching the markets with utmost caution. Blind chase of the momentum should be avoided and fresh purchases, if any, should not only be keep limited in terms of leverage, but also should be kept limited to defensive stocks. Taking a cautious view of the week is advised for the day.
Sector Analysis for the Coming Week
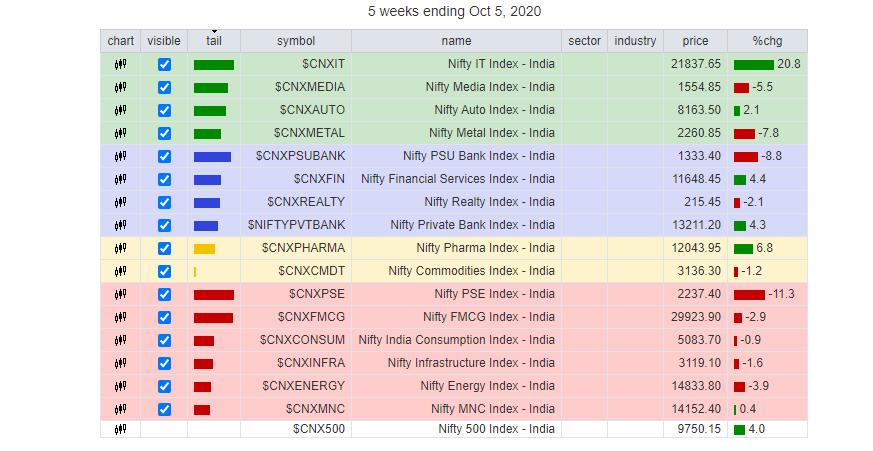
In our look at Relative Rotation Graphs®, we compared various sectors against CNX500 (NIFTY 500 Index), which represents over 95% of the free float market cap of all the stocks listed.
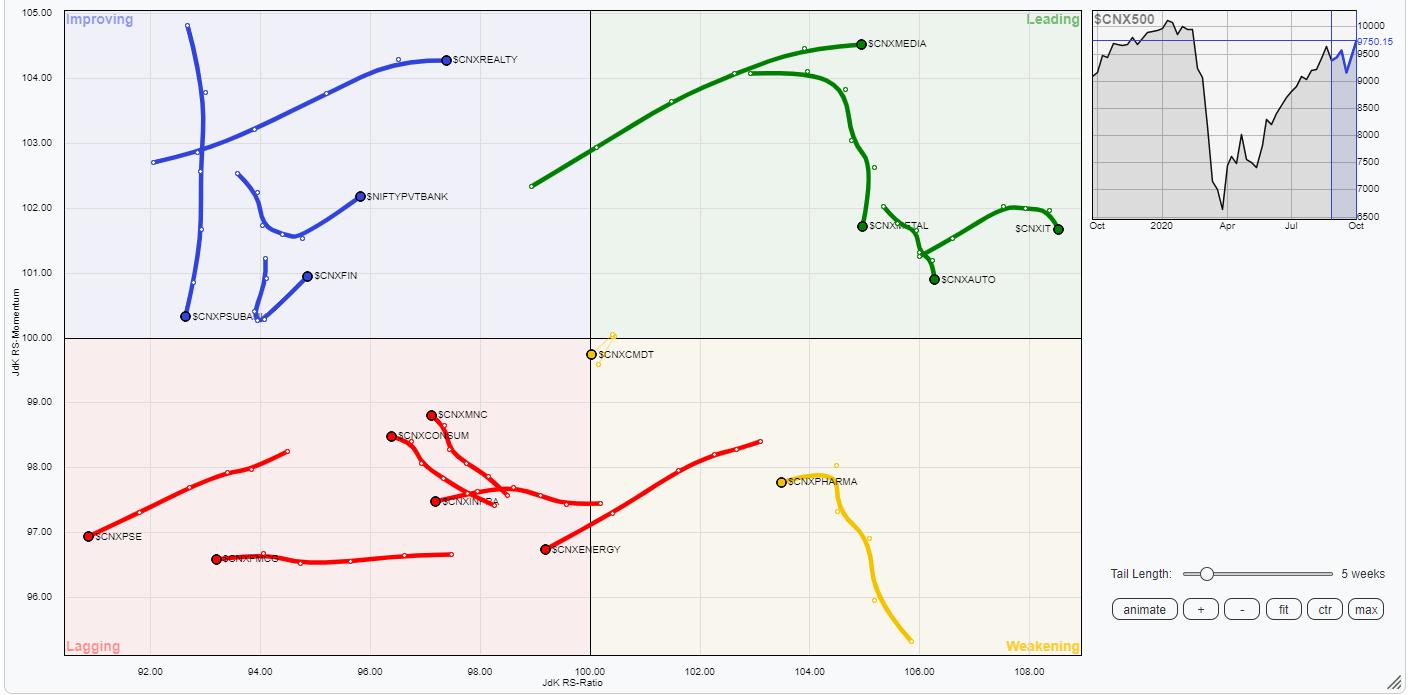
The review of Relative Rotation Graphs (RRG) shows that the financial stocks have rotated positively after a sharp improvement of relative momentum on the expected lines.
The Media, IT, Metal and the Auto Indexes are in the leading quadrant. While IT and Media are comfortably placed, the METAL and AUTO sectors are showing sharp paring on the momentum front. These groups may continue to relatively outperform the broader markets.
The NIFTY Private Bank, Financial Services and BankNIFTY have shown a sharp improvement in the relative momentum. While remaining in the improving quadrant, they appear to be rotating favorably. NIFTY Realty also is firmly placed in the improving quadrant. PSUBanks are yet to show a notable pickup and appear to be losing relative momentum while still being in the improving quadrant.
The Pharma sector has taken a breather; it is currently placed in the weakening quadrant.
The ENERGY Sector has entered the lagging quadrant. Along with this, the INFRA, FMCG and PSE sectors also continue to languish in the lagging quadrant. The Consumption group has continued to show some improvement, but it still in the process of bottoming out and is currently placed in the lagging quadrant.
Important Note: RRG™ charts show the relative strength and momentum for a group of stocks. In the above chart, they show relative performance against NIFTY500 Index (Broader Markets) and should not be used directly as buy or sell signals.
Milan Vaishnav, CMT, MSTA
Consulting Technical Analyst,


