The market action in this week fared precisely on the anticipated lines. In the previous weekly outlook, we had mentioned the markets were firmly placed but, at the same time, staying overstretched on the short-term charts. It was also mentioned that any up moves will face stiff resistance at higher levels. Keeping in line with this analysis, this week NIFTY found itself resisting to the 12000-levels through the week. The index ended up finding very strong resistance near this point and saw sharp corrective move from that level. Despite a technical pullback on Friday, the headline index ended the week with a net loss of 151.75 points (-1.27%) on a weekly basis.
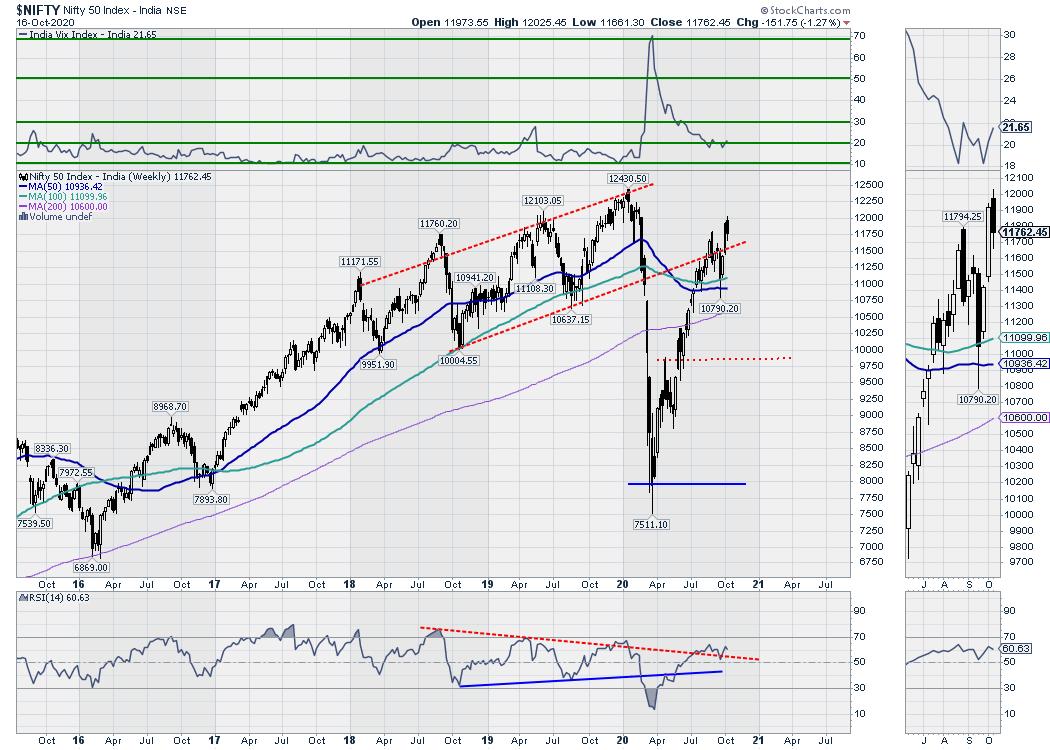
From the technical perspective, the NIFTY's finding constant resistance near the 12000-levels and the subsequent corrective move is an important technical development. This has made this level an intermediate top for the markets in the near-term. This has also pushed the markets in a broad consolidation range, with the zone of 10936-11099 acting as one of the most important pattern-supports for the markets. This zone is made up of 50-Week MA, which stands at 10936, and 100-Week MA, which stands at 11099. The volatility, which had spiked 11.06% a week before this one, surged another 6.21% to 21.65.
The start to the week is likely to stay jittery this time. The levels of 11880 and 11950 will act as resistance points. The supports will come in at the 11600 and 11510 levels. The trading range in the coming week is likely to stay higher than usual given the current technical setup on the charts.
The weekly RSI is 60.63; it remains neutral and does not show any divergence against the price. The weekly MACD is bullish; it trades above the signal line. A black body occurred on the candles. This body of the present candle has not extended itself near the halfway point of the previous week's candle; it did not create a classic "Dark Cloud Cover" which could have been created. However, it reflects the bearish undertone of the week.
The pattern analysis reflects the index inside the channel again. This channel was violated when the NIFTY broke down from that channel. Now, with NIFTY inside that channel again, ideally speaking, the lower trend line of that channel should play out as supports in the near term.
Overall, the markets have formed an intermediate top near the 12000 level; the markets will find it difficult to move past this level too soon. The current moves in the markets have pushed them in a broad consolidation range, with the zone of 50- and 100-Week MA becoming major supports going ahead. We cannot rule out intermittent technical pullbacks, but all moves on the upside may see profit-taking bouts at higher levels.
There are possibilities of some tactical shift happening in the sectors as well in the weeks to come. We recommend keeping purchases less aggressive, and it would be rewarding to stick to defensives and staying highly stock-specific while making purchases.
Sector Analysis for the Coming Week
In our look at Relative Rotation Graphs®, we compared various sectors against CNX500 (NIFTY 500 Index), which represents over 95% of the free float market cap of all the stocks listed.

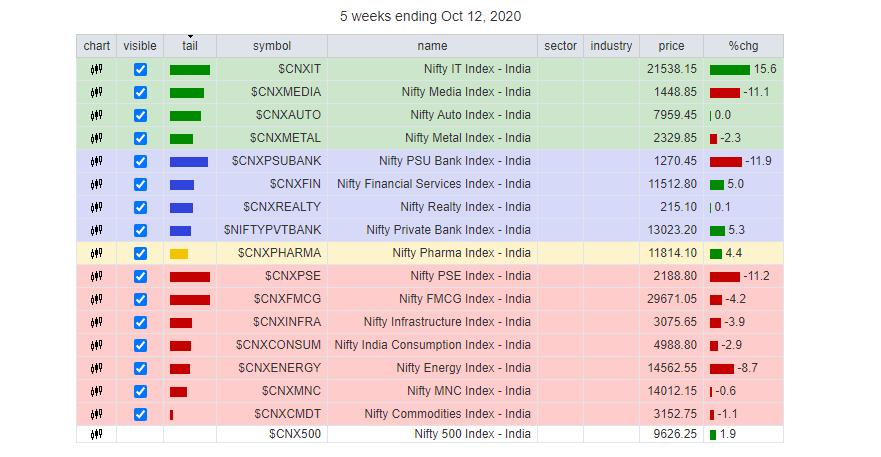
The review of Relative Rotation Graphs (RRG) shows that, despite the start of relative outperformance in the financial stocks, the PSU banks are yet to show any good performance and have not improved on their relative momentum just as yet.
The NIFTY Auto, IT, Media and Metal indices remain in the leading quadrant. However, the Metal and Auto are seen sharply paring on their relative momentum. These groups may post relative outperformance against the broader markets, but the Metals and Auto packs may contribute less as compared to the IT and Media groups.
NIFTY Pharma is in the weakening quadrant. After an improvement on the momentum, it appears to be taking a breather and moving towards the lagging quadrant.
The Commodities groups have taken a U-turn for the negative and entered the lagging quadrant. The NIFTY Energy, Consumption, FMCG, Infrastructure and PSE groups are in the lagging quadrant. Except for the consumption pack, which is showing some improvement in its relative momentum, the rest continue to languish in the lagging quadrant. They may collectively underperform the broader NIFTY 500 index, except some stock-specific show from the consumption group.
The NIFTY Realty, Banknifty, Financial Services and Services sector indices are in the improving quadrant. They may continue to show improving performance and resilience going ahead. The NIFTY PSUBanks Index is also in the improving quadrant. However, it is paring its momentum sharply and is on the verge of pushing itself inside the lagging quadrant once again.
Important Note: RRG™ charts show the relative strength and momentum for a group of stocks. In the above chart, they show relative performance against NIFTY500 Index (Broader Markets) and should not be used directly as buy or sell signals.
Milan Vaishnav, CMT, MSTA
Consulting Technical Analyst | www.EquityResearch.asia | SEBI Regd. No. INH000003341


