The week before this one was quite eventful, as the NIFTY tested all its crucial supports on the daily and weekly charts. The past week saw the NIFTY respecting few crucial support levels on the higher timeframe charts and showing a technical pullback. The four-day trading week showed the headline index staging a comeback. The positive point was that the rally seen over the past couple of days was not merely on the ground of short covering; the markets also witnessed some buying from lower levels. The NIFTY managed to recover 75% of the loss of the earlier week as it ended with net gains of 366.70 points on a weekly note.
The coming week will see the Indian equities adjusting to a global trade setup as Friday was a trading holiday in India. There might be some knee-jerk reactions and volatile moves due to the US Markets' reactions to the President and his wife testing positive for COVID and the likely implications on the election campaigns.
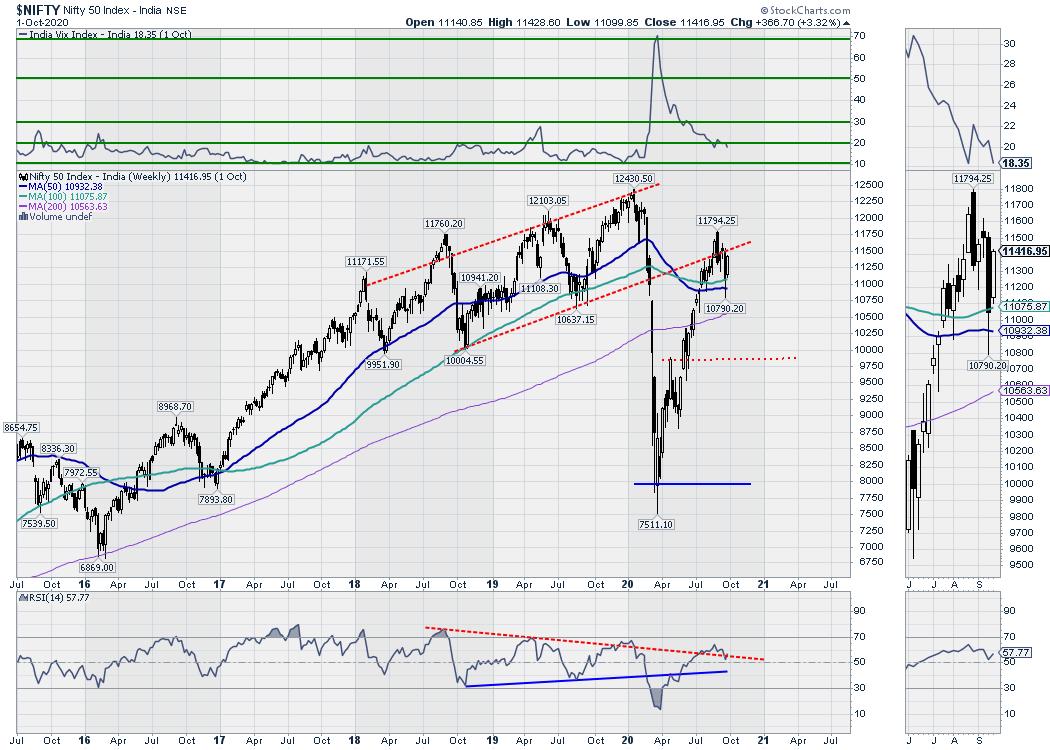
The NIFTY has reinforced the level of the 100-Week MA as a crucial support by first taking support on it on a closing basis and bouncing off from that level. The 100-Week MA stands at 11075. The US Dollar Index is showing signs of weakness again; this will continue to benefit the emerging markets, per se.
The levels of 11530 and 11700 will act as next overhead resistance points in the event of any continued up move. The supports will come in at the 11310 and 11130 levels. The trading range for the coming week is expected to stay wider than usual.
The weekly RSI is 57.77; it has marked a 14-period high which is bullish. It also appears to be attempting to breakout from a formation. The weekly MACD is bullish and trades above the signal line. An Inside Bar occurred. It usually occurs with a lower top and higher bottom occurring on the present bar. Also, a Bullish Harami is observed on the candles. Though this is not a classic Bullish Harami, the current white body of the candle is completely engulfed by a larger black body on the previous bar. This happening near a support point of 100-Week MA makes this level an important support over the near term.
The pattern analysis shows that the Index may be on its way to try taking out few critical resistances on the shorter time frame charts. Currently, the zone of 10932 and 11075 remains an important support zone; this is comprised of the 50-Week MA and 100-Week MA.
All in all, so long as the NIFTY stays above the 50- and 100-Week MAs (i.e. above the 10932-11075 zone), it will see broad ranged consolidation without breaking down. Structural weakness will creep in only if the Index slips below this zone. On the upper hand, amid global uncertainty and aided by weakness in the US Dollar, some moves on the upside cannot be ruled out. Even if we see some uncertain volatile moves initially, we recommend staying away from creating major shorts. Dips may be used to make fresh purchases while staying vigilant and guarding profits at higher levels, as the risk-on setup may have some steam left so long as the NIFTY defends the crucial zone of 10932-11075 in the near term.
Sector Analysis for the Coming Week
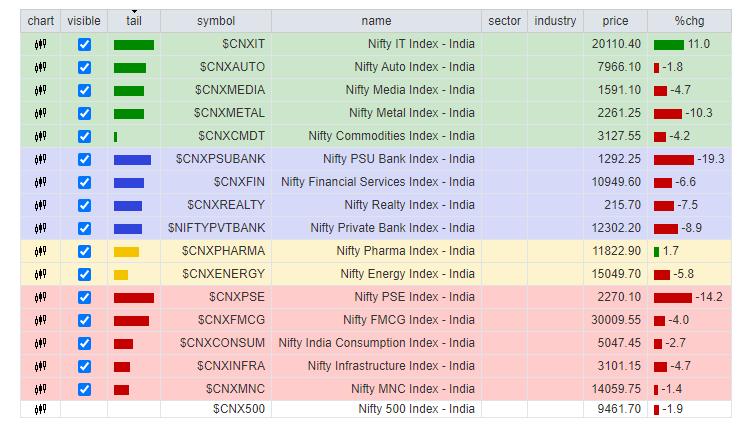
In our look at Relative Rotation Graphs®, we compared various sectors against CNX500 (NIFTY 500 Index), which represents over 95% of the free float market cap of all the stocks listed.
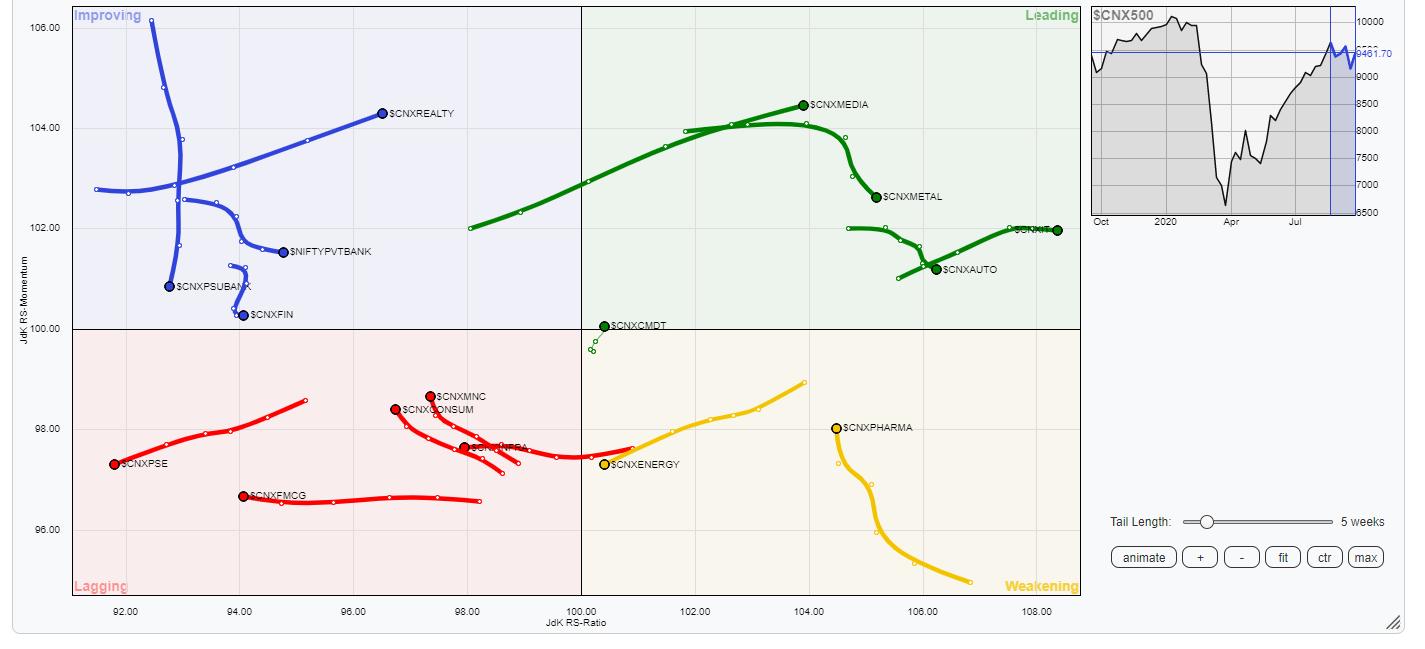
The review of Relative Rotation Graphs (RRG) shows the possibility of some likelihood of financial stocks gathering some momentum again.
The NIFTY IT, MIDCAP100, AUTO, Media and Metal groups remain in the leading quadrant. These sectors will continue relatively outperforming the broader markets over the coming days.
NIFTY Pharma is still in weakening quadrant. However, it appears to be heading northward while trying to improve its relative momentum. NIFTY Energy continues to rotate southwest while staying in the weakening quadrant and heading towards lagging.
FMCG and Consumption indexes are in the lagging quadrant. However, some divergence is seen in the trajectory of the tail, as the Consumption pack is trying to improve its relative momentum as the FMCG continues to languish. NIFTY PSE and Infrastructure index also remain in the lagging quadrant.
NIFTY Realty stays firm in the improving quadrant. While NIFTY PSUBanks are yet to start playing catch-up, the Financial Services group and BankNifty appear to have started consolidating their recent underperformances while staying in the improving quadrant.
Important Note: RRG™ charts show the relative strength and momentum for a group of stocks. In the above chart, they show relative performance against NIFTY500 Index (Broader Markets) and should not be used directly as buy or sell signals.
Milan Vaishnav, CMT, MSTA
Consulting Technical Analyst,


