Unlike the previous week that had stayed uneventful for the markets, the Indian equities witnessed an immensely volatile week that ended this Friday, September 25, 2020. The markets saw a good start to the week, but the second half of the week stayed terribly volatile, with the markets ending with deep cuts despite the recovery on the last trading day of the week. Over the past five sessions, the NIFTY oscillated over 745-points, i.e. close to 7% before ending with a net loss of 454.70 points (-3.95%) on a weekly note.
When I just said that the past week was an eventful one, it indeed was an eventful one from a technical perspective.
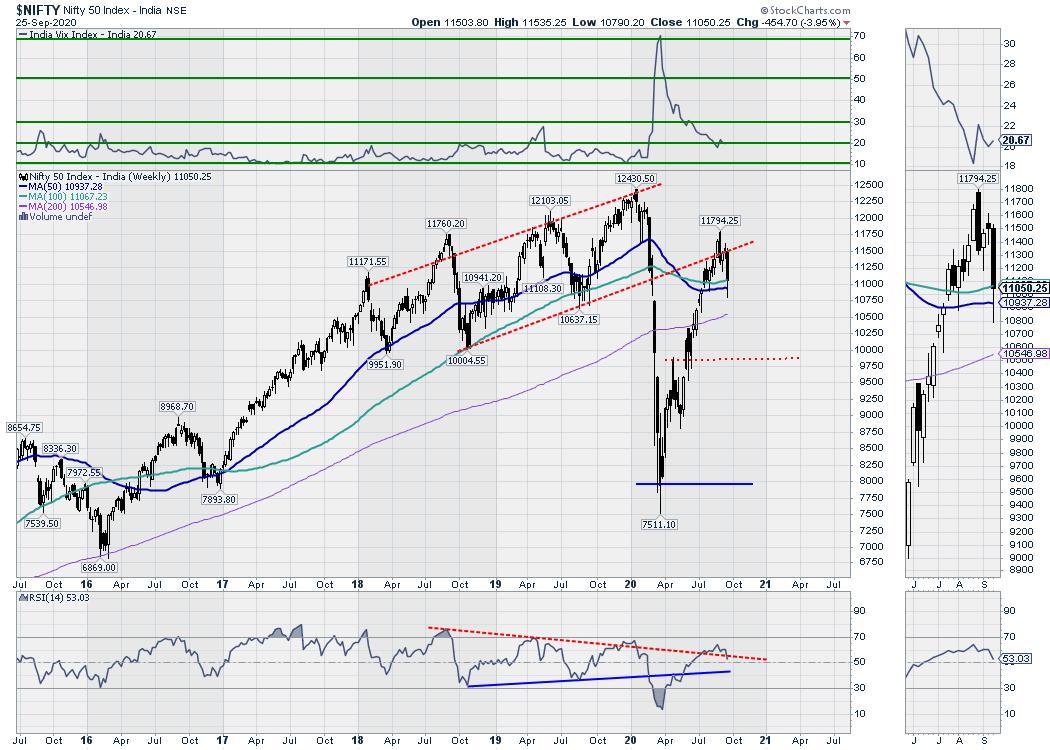
The NIFTY went very close to 200-DMA, which presently stands at 10758. On the weekly charts, the Index violated a crucial zone that existed between the 10930-11070 levels. This is made of the 50-Week MA and 100-Week MAs, which are currently placed at 10937 and 11067 respectively. After violating this crucial pattern support zone, the NIFTY managed to crawl just near the 100-Week MA. We would also be ending this week as well as the month in between; any lower levels at monthly close will likely mark a potential short-term top in place.
We have a short week coming up, with Friday being a national holiday on account of Gandhi Jayanti. The coming four trading days are likely to see the NIFTY trading with limited upsides and some incremental volatility as well. The levels of 11090 and 11190 will act as resistance points. The supports come in lower at 10930 and 10810 levels.
The Weekly RSI is 53.03; it remains neutral and does not show any divergence against the price. The weekly MACD is bullish as it remains above the signal line. The slope of the histogram, however, suggests decelerating momentum. A large black body emerged on the candles, signifying the grip of the bearish moves in the market.
The pattern analysis on the weekly chart not only sees a formation of a potential lower top near 11800, but also sees the NIFTY falling out from a large, sharp rising wedge that was formed during the lows formed in March. Presently, it has tested the crucial support zone of 10930-11070. Any breach of this zone is set to invite incremental weakness in over coming weeks.
The RS line of NIFTY50 Index against the broader NIFTY500 Index is seen declining steadily and has also slipped below its 50-Week MA. This is likely to see the broader markets continuing to relatively outperform the frontline index.
Some possibilities of short-covering happening cannot be ruled out over coming days; however, the upsides will continue to remain capped. We recommend adopting a highly sector-specific approach. Staying with defensive stocks will be rewarding over the coming weeks even if they relatively underperform over the immediate short-term.
Sector Analysis for the Coming Week
In our look at Relative Rotation Graphs®, we compared various sectors against CNX500 (NIFTY 500 Index), which represents over 95% of the free float market cap of all the stocks listed.
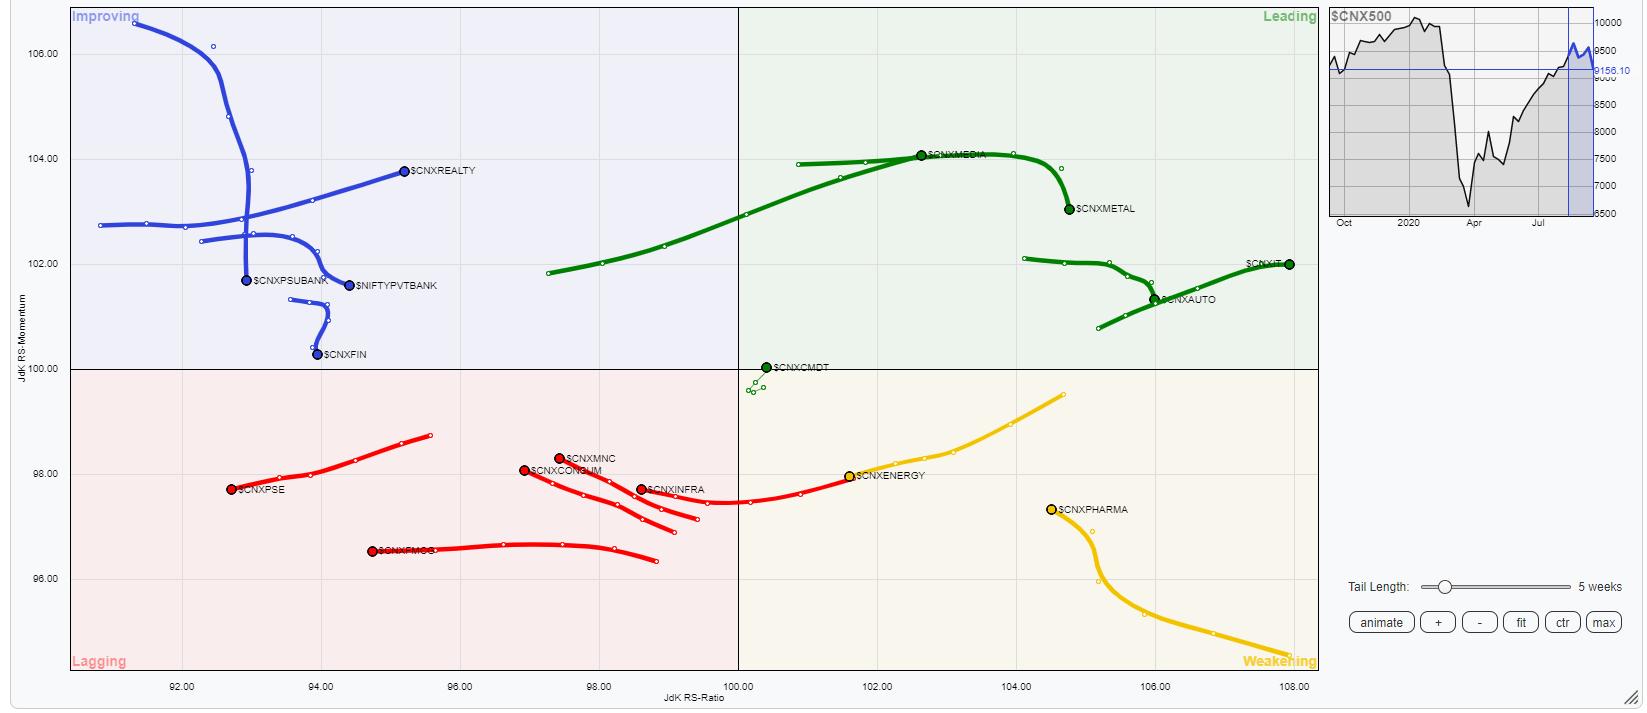
The review of Relative Rotation Graphs (RRG) shows the possibility of broader markets performing relatively better over the coming days.
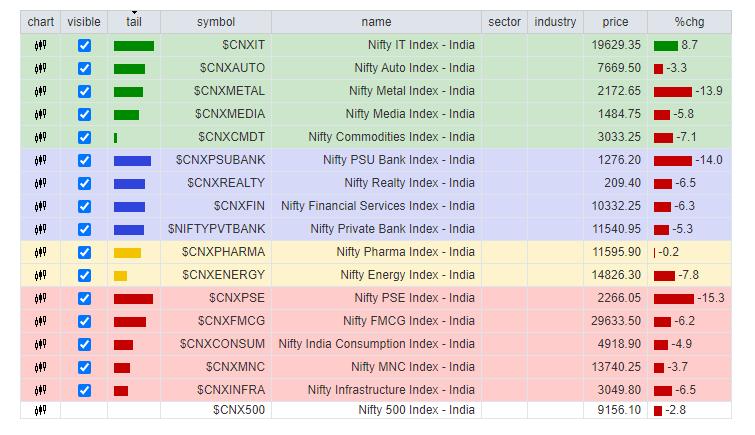
The NIFTY MidCap 100, NIFTY Media and NIFTY IT indexes stay firm in the leading quadrant. They are likely to continue relatively outperforming the broader NIFTY500 Index. NIFTY Auto is also in the leading quadrant, but it is seen paring its momentum along with the NIFTY Metal Index. However, these groups may perform better than the other pockets.
NIFTY Pharma remains in the process of consolidating its performance while remaining in the weakening quadrant. NIFTY Energy index is advancing in the south-west rotation and also remains in the weakening quadrant.
NIFTY Infra has advanced further inside the lagging quadrant along with the FMCG and PSE pack. The NIFTY Consumption group is also in the leading quadrant, but it appears to be improving on its relative momentum and may show some stock-specific performance. The remaining indices will continue to underperform the broader markets.
The PSU Banks are seen rotating negatively towards the lagging quadrant unless their performance improves. The BankNIFTY also remains in the improving quadrant along with Financial Services index. However, the direction of the rotation, i.e. the tail is not in the desired direction and they appear to be steadily losing their momentum. The Realty Index remains firm inside the improving quadrant.
Important Note: RRG™ charts show the relative strength and momentum for a group of stocks. In the above chart, they show relative performance against NIFTY500 Index (Broader Markets) and should not be used directly as buy or sell signals.
Milan Vaishnav, CMT, MSTA
Consulting Technical Analyst,
www.EquityResearch.asia


