While trading on expected lines, the Indian equity markets did not make any major directional moves and consolidated in a defined range. The NIFTY did not move past the previous week's high point and consolidated while resisting to that level. The trading range also remained narrower than what it was a week before this one. The index oscillated in 240-odd points over the past five days. The entire week remained within the range of the previous week for forming a slightly lower top and a higher bottom on the bar charts. After spending the entire week in a limited zone, the headline index ended with a net gain of 167.90 points (+1.43%) on a weekly basis.
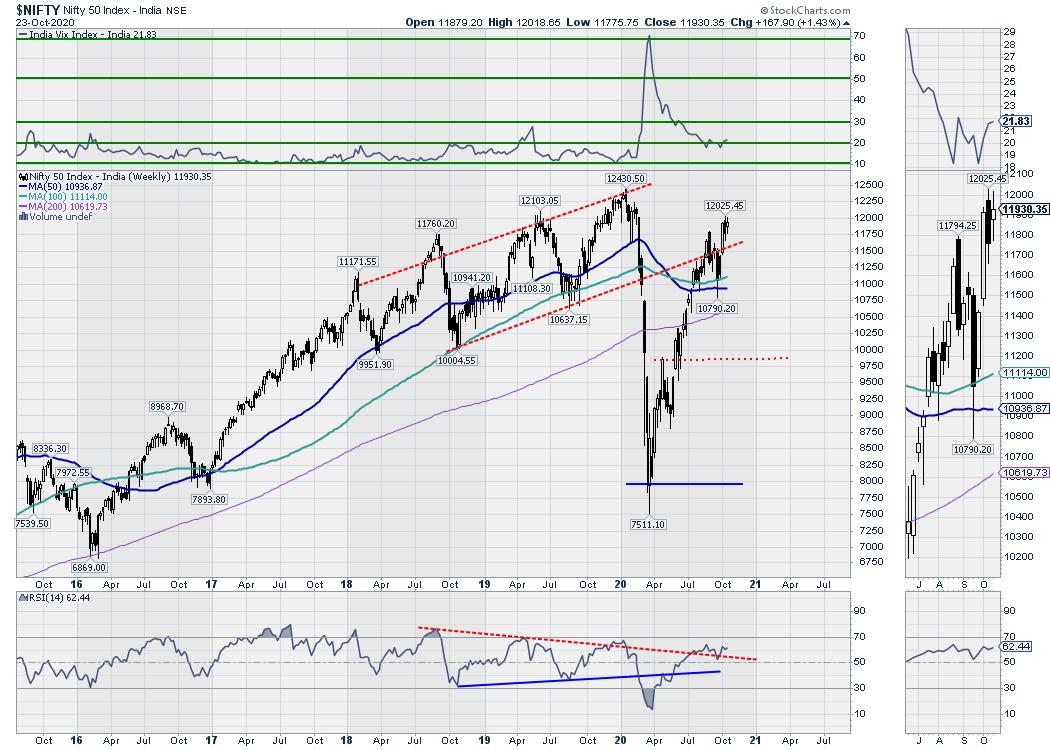
The coming week remains extremely important from many technical perspectives. From a purely analytical point of view, the 12000-mark remains a major and important resistance level, both from the classical point of view and also as indicated by the derivatives data. Importantly, Equities, as an asset class, have slipped into the weakening quadrant on the RRG, while High Yield Debt and Treasuries have entered the improving quadrant of the RRG. The slipping of the Equities in the weakening quadrant points toward a likely end of the relative outperformance of Equities, among other asset classes. The volatility remained virtually absent, as the INDIAVIX gained just 0.84% on a weekly basis.
The start to the week is likely to be on a soft note. The levels of 12025 and 12120 will act as resistance points. The supports come in at 11800 and 11710 levels.
The weekly RSI is 62.44; it is neutral and does not show any divergence against the price. The weekly MACD is bullish as it trades above the signal line. Following the formation of an inside bar, where the high of this week is slightly lower than the previous week's high and the low of this week is higher than the previous week's low, had led to a formation of a Harami pattern on the Candle. This is a bullish Harami candle; however, it is equally important to note that since it has occurred near the high point, it is not expected to be potent and should best be ignored in the present technical setup.
The slipping of the Equities in the weakening quadrant should not be confused with any possibilities of large drastic downsides. Equities may continue to perform individually - however, it may underperform as compared to the other asset class. The US Dollar is showing some signs of mild technical pullback once again and this may have its own effect on the emerging markets.
Overall, we expect a clear shift of focus over the coming days to defensive stocks. Some classical defensives like consumption, FMCG and Pharma may come into focus once again, while high beta and riskier stocks may take a backseat. We recommend avoiding large leveraged purchases unless the NIFTY moves past the 12000 levels convincingly. Until this happens, exposures should strictly be curtailed to defensive stocks while adopting a highly stock-specific approach.
Sector Analysis for the Coming Week
In our look at Relative Rotation Graphs®, we compared various sectors against CNX500 (NIFTY 500 Index), which represents over 95% of the free float market cap of all the stocks listed.
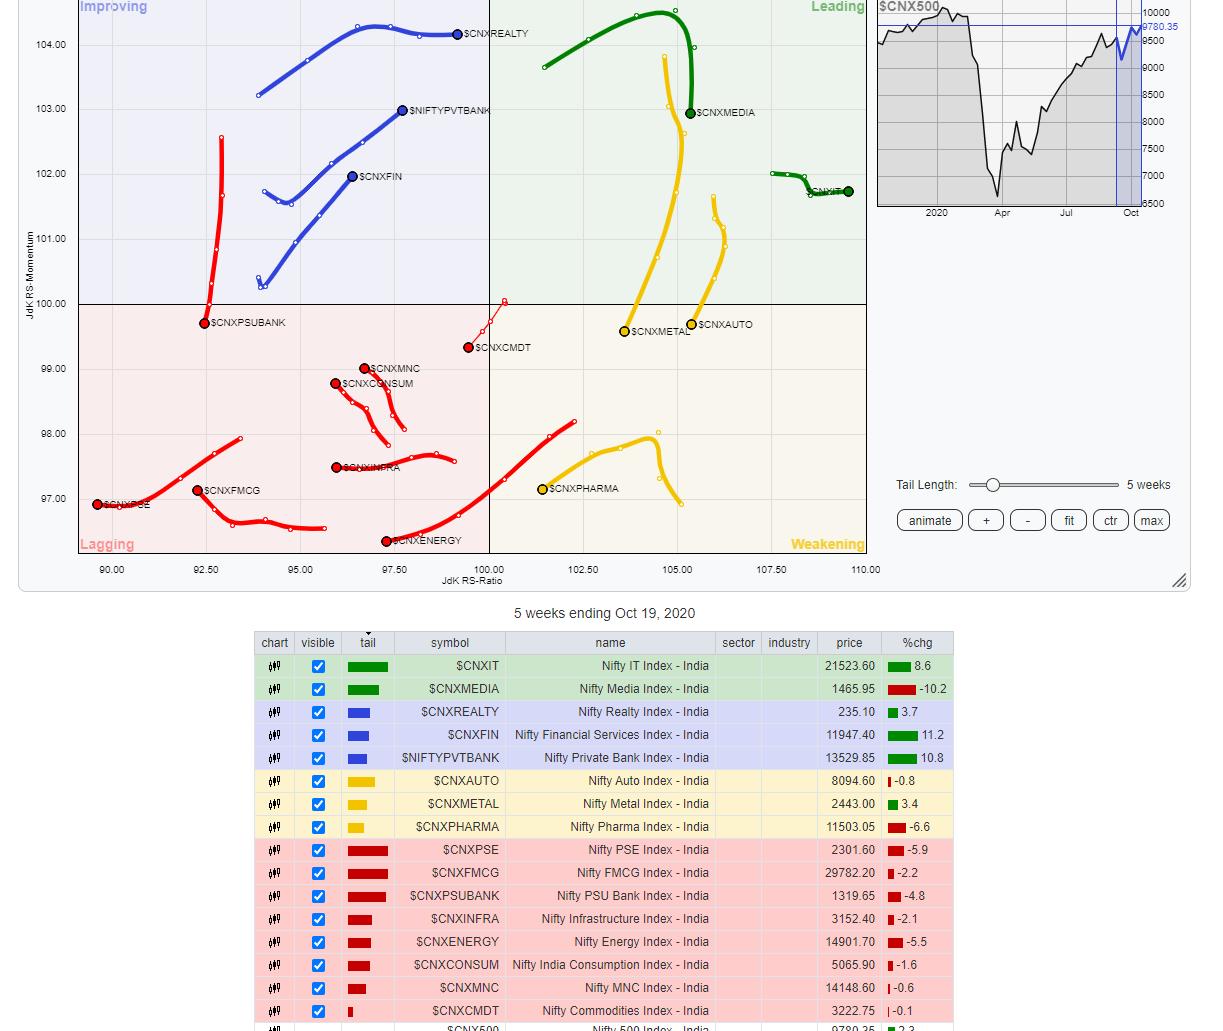
The review of Relative Rotation Graphs (RRG) shows that a few sectors are handing over the relay baton to other sectors while they get ready to take a breather.
The NIFTY IT index is the only sector that is firmly placed in the leading quadrant. Apart from this, the broader NIFTY MIDCAP 100 is in the leading quadrant, but is seen sharply losing momentum and rotating in a south-westerly direction. This also appears to be the case with NIFTY Media group.
The Metal Index has slipped into the weakening quadrant, marking a likely end to its relative outperformance. On very similar lines, NIFTY Auto Index has also slipped into the weakening quadrant. Pharma Index continues to remain in the weakening quadrant.
The PSU Bank Index has slipped inside the lagging quadrant again following a negative rotation. In addition, Infrastructure and PSE indexes also continue to languish in lagging. The NIFTY Consumption and FMCG groups are also in the lagging quadrant, but they appear to be improving on their relative momentum. However, they have yet to bottom out completely.
The NIFTY Financial services index is firmly placed in the improving quadrant along with BankNIFTY, Realty and Services Sector Index. All these groups are likely to show stock-specific outperformance over the coming days.
Important Note: RRG™ charts show the relative strength and momentum for a group of stocks. In the above chart, they show relative performance against NIFTY500 Index (Broader Markets) and should not be used directly as buy or sell signals.
Milan Vaishnav, CMT, MSTA
Consulting Technical Analyst,


