The equity markets are presently dealing with one of their most important pattern resistances over the previous days. In the previous note, we had mentioned the importance of this pattern resistance line; it was also mentioned that, unless the zone of 12960-13000 is taken out comprehensively, we may not see any major up move in the markets. In line with this analysis, even when the NIFTY marked an incremental lifetime high point, it came off from the highest point before it ended for the week. After marking a new lifetime high at 13145, the headline index ended with a net gain of 109.90 points (+0.85%) on a weekly basis.
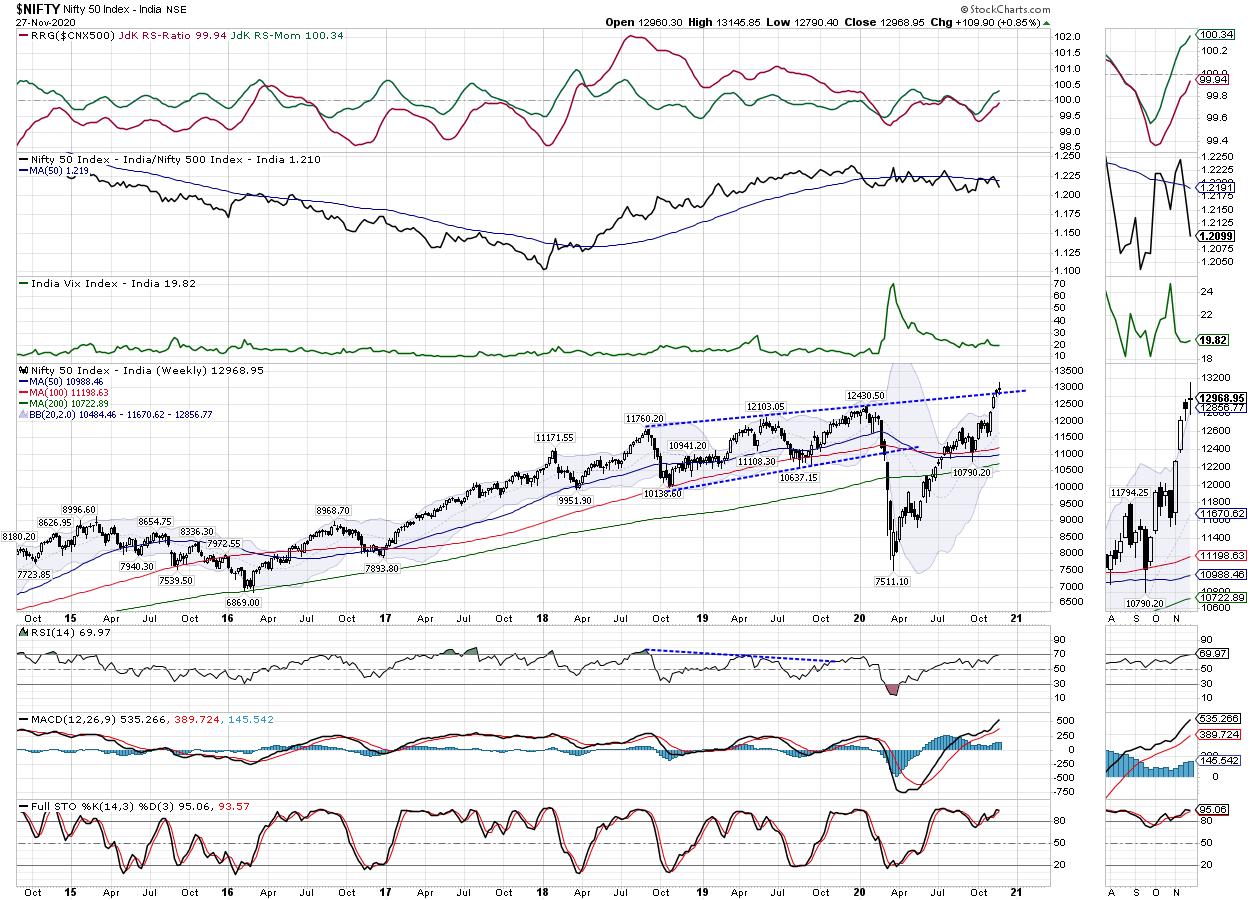
If we examine the technical setup on a standalone basis, the NIFTY has defended this trend line resistance by staying above it. This makes the low point of the previous week, i.e. 12790, a very important level. On the other hand, it has exhibited all the signs that makes the 13145 level a potential top for the markets, as the NIFTY is yet to close above the 13000 levels. The volatility reported no major change this week, with the INDIAVIX rising just 1.02% to 19.8200 on a weekly note. For the coming week and beyond, the sustenance of the NIFTY above 12800 would be an extremely crucial thing to watch for.
Since the coming week is truncated with Monday being a trading holiday, we will see the opening on Tuesday adjusting to the global setup as Monday will have all the global markets open. The levels of 13100 and 13225 will act as resistance. Supports come in lower at 12800 and 12690 levels.
The weekly RSI is 69.97; it has made a fresh 14-period high, which is bullish. The RSI is neutral and does not show any divergence against the price. The weekly MACD is bullish and trades above the signal line. A Doji appeared on the weekly candles. Its occurring on a high point is something that should not be ignored. It has a potential to stall the present rally and mark an intermediate top at the high point.
With the coming week being truncated, it will be crucial for the NIFTY to keep its head above the 12800 level. Moving past this level has marked an attempt by the Index to stage a breakout, as it penetrated the 2-yr long trend line resistance. However, this attempt of a breakout will remain in force only if the Index stays above the 12800 mark. If the NIFTY slips below this level, we will see this trend line pattern resistance continuing to pose a stiff hurdle going ahead, and it will also mark the level of 13145 as a potential top.
We recommend staying focused on the stocks and sectors that had underperformed on relative terms in the past and are showing signs of improvement in their respective relative strengths against the broader markets. We expect the week to continue to stay stock- and sector-specific and expect the sectors like Consumption, FMCG, Pharma and select Mid-Caps to do well against the broader markets.
Sector Analysis for the Coming Week
In our look at Relative Rotation Graphs®, we compared various sectors against CNX500 (NIFTY 500 Index), which represents over 95% of the free float market cap of all the stocks listed.
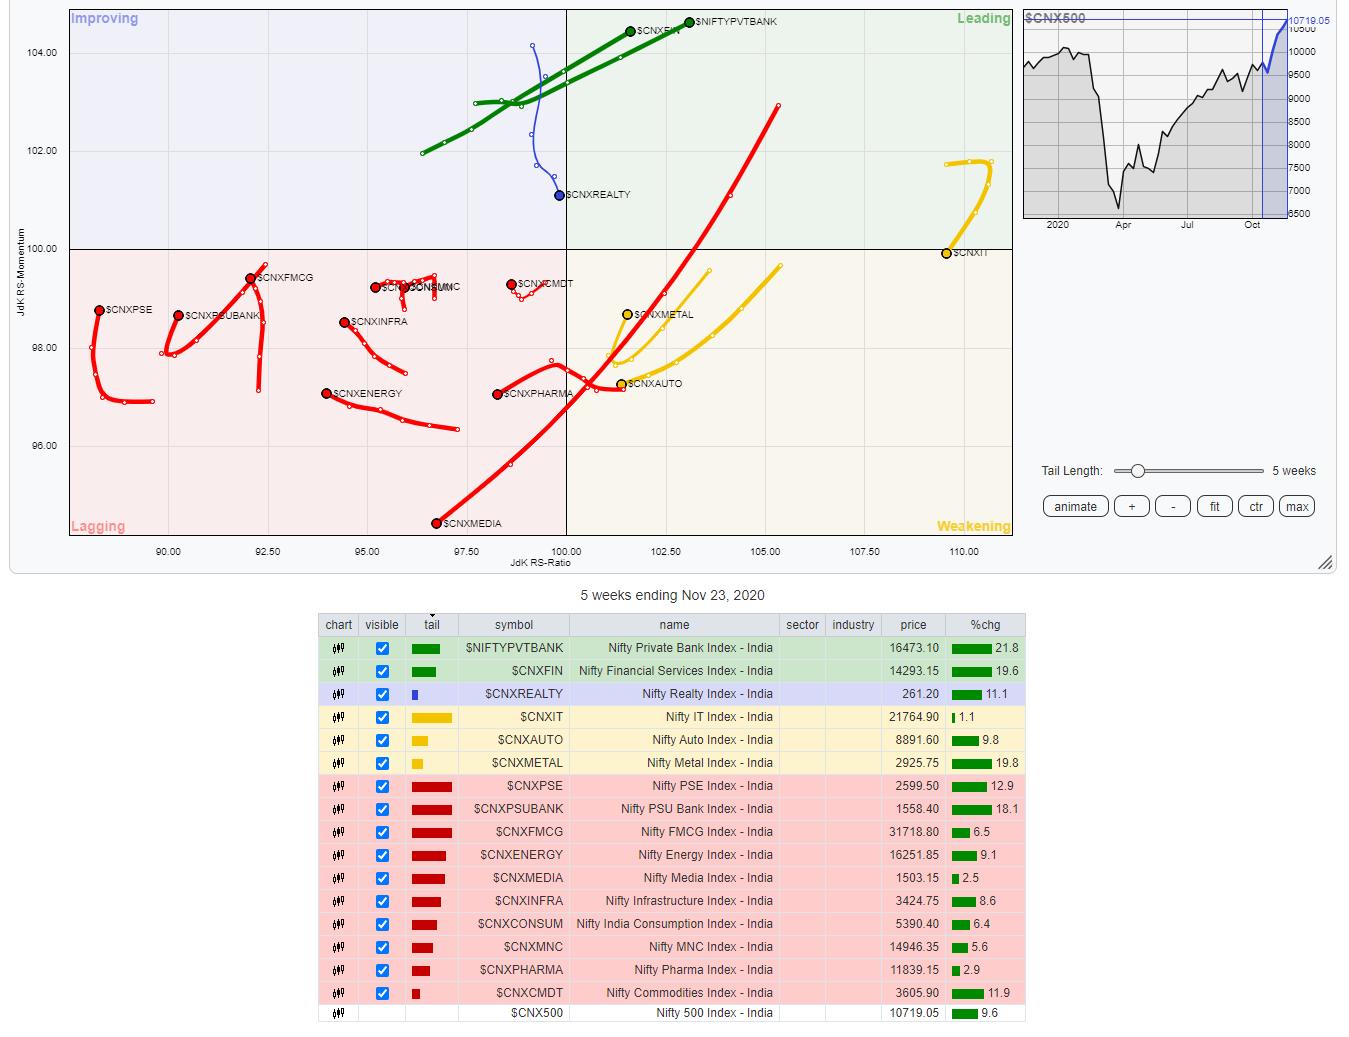
The review of Relative Rotation Graphs (RRG) shows BankNIFTY and the NIFTY Services sector staying firmly in the leading quadrant along with the NIFTY Services sector Index. These three groups are set to relatively outperform the broader NIFTY500 Index.
The IT Index has slipped inside the weakening quadrant. The NIFTY Auto and Midcap 100 continue to crawl further down inside the weakening quadrant. NIFTY Metal, on the other hand, is seeing a sharp U-turn inside the weakening quadrant. This may show some sporadic outperformance against the broader markets.
Media and Pharma indices are placed inside the weakening quadrant. So are the Infrastructure, PSU Bank and PSE Indexes. However, except for the Media, the other groups are showing improvement in their relative momentum and appear to be consolidating, or at least have arrested their decline. The FMCG, Consumption and PSU Bank Indexes are also in the weakening quadrant. However, they all seem to be improving sharply on their relative momentum front.
The Nifty REALTY is the only index in the improving quadrant. However, it appears to be rapidly paring its relative momentum.
Important Note: RRG™ charts show the relative strength and momentum for a group of stocks. In the above chart, they show relative performance against NIFTY500 Index (Broader Markets) and should not be used directly as buy or sell signals.
Milan Vaishnav, CMT, MSTA
Consulting Technical Analyst,


