In the previous weekly note, we mentioned that the NIFTY was testing its crucial pattern resistance. Over the past five trading sessions, the markets, in general, displayed some corrective tendencies, but continued to extend gains. As compared to the previous two weeks, which had a wide trading range of 723 and 400 points respectively, this week had a much narrower trading range as the index oscillated in the range of 230-odd points. Following a capped but volatile move over the past days, the headline index ended with a net gain of 139.10 points (+1.09%) on a weekly basis.
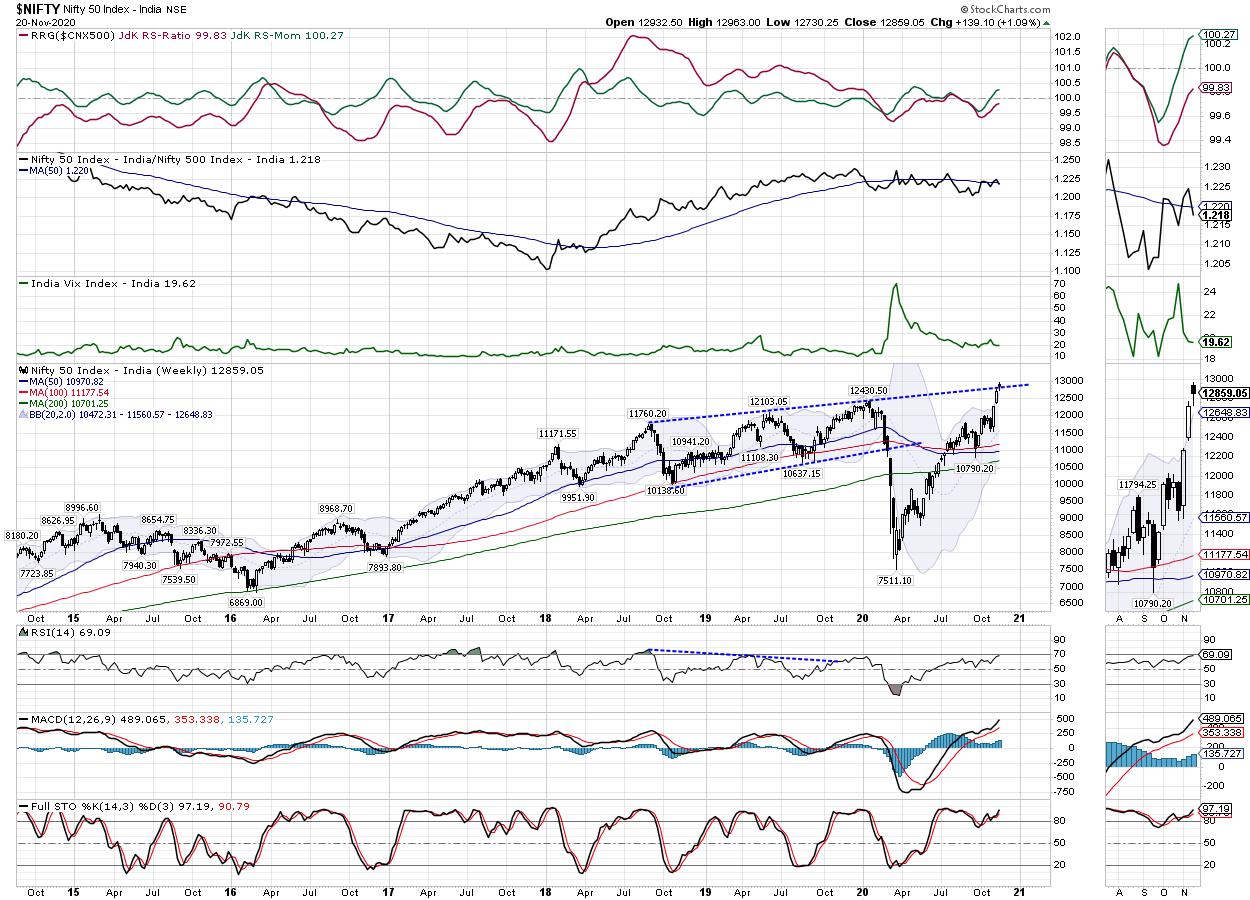
Despite sharp profit-taking bouts witnessed in-between the past five sessions, the volatility remained quite unchanged. The INDIAVIX lost just 0.43% over the week and stood at 19.62. NIFTY has not moved the 2-yr long pattern trend line resistance, though it tried to inch out a bit. This trend line remains a stiff resistance over the coming days and the levels of 12963 is now a potential intermediate top for the markets, unless taken out comprehensively. Over the coming days, NIFTY's behavior against the level of 12963 and the pattern trend line resistance will be important to watch.
The coming week has the monthly derivatives expiry lined up. The levels of 12960 and 13135 will act as potential resistance points. Supports will come in at 12750 and 12530. Any retracement or corrective move is set to make the trading range wider this coming week.
The weekly RSI is 69.09; it has marked a new 14-period high, which is bullish. RSI is neutral and does not show any divergence against the price. The weekly MACD is bullish and trades above the signal line.
A candle resembling a small hanging man occurred on the charts. This is not a classical hanging man, as it has a small upper shadow which is supposed to be ideally absent in hammers or hanging man patterns. However, occurrence of such candles near a strong pattern resistance area highlights the importance of the pattern resistance and may potentially stall a rally as it has occurred following a downtrend. However, this will require confirmation on the next bar.
The coming week remains crucial for the markets in ways more than once. On the shorter and daily time frame, the NIFTY remains grossly overstretched. Also, it is now in uncharted territory and has marked the level of 12963 as an intermediate potential top unless taken out comprehensively. The improvement of relative strength in traditionally defensive sectors like FMCG, Consumption, Pharma, etc. is noticed, and this trend may continue over the coming days as well.
Sector Analysis for the Coming Week
In our look at Relative Rotation Graphs®, we compared various sectors against CNX500 (NIFTY 500 Index), which represents over 95% of the free float market cap of all the stocks listed.
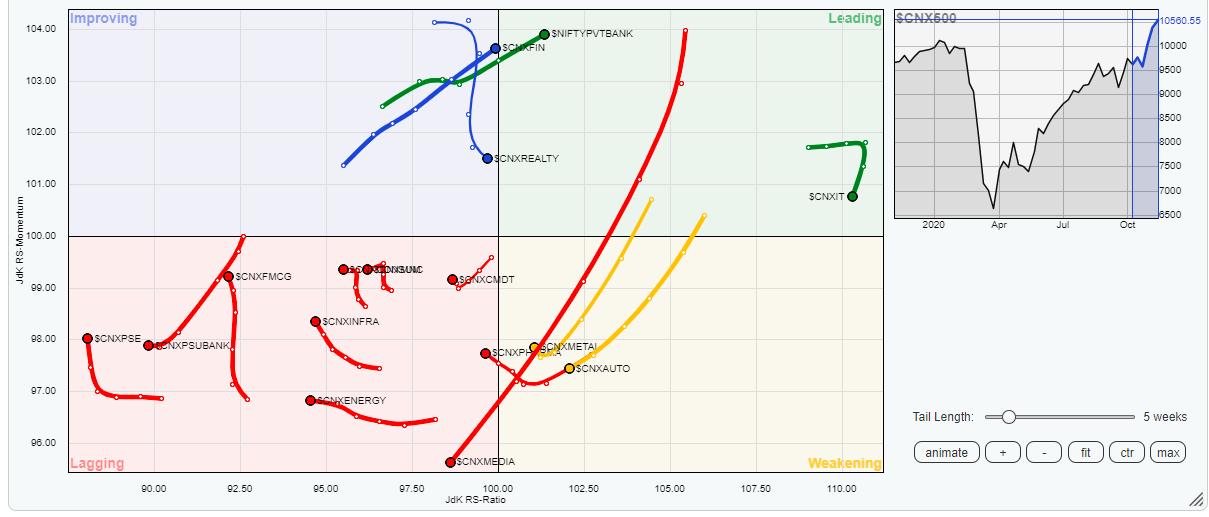
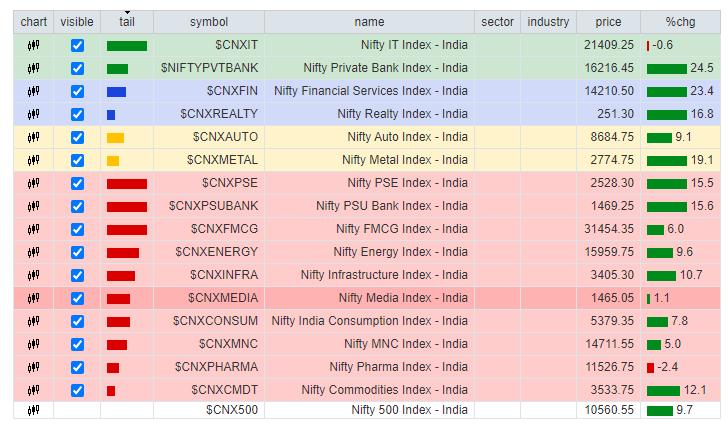
Our review of Relative Rotation Graphs (RRG) shows that NIFTY Bank (BankNifty) has entered the leading quadrant, as it is likely to continue relatively outperforming the broader markets. The NIFTY Services Sector Index is also in the leading quadrant and appears to be maintaining its relative momentum as well. The NIFTY Services sector has just crawled inside the leading quadrant. The IT Index continues to be in this quadrant as well, but appears to be losing its relative moment.
The broader NIFTY MidCap100 and NIFTY Auto drifted further down in the weakening quadrant. NIFTY Metal remains in the weakening quadrant but can be seen picking up again on the relative momentum front. NIFTY Pharma and NIFTY Media Indices have crawled inside the lagging quadrant. Media Index continues to drift lower, but Pharma appears to be picking up a bit.
NIFTY PSU Banks, Infrastructure, PSE, Energy FMCG and Consumption Indices are in the lagging quadrant. Among these, FMCG, Consumption and PSE appear to be improving their relative momentum and look like they are in the process of getting bottomed out.
Important Note: RRG™ charts show the relative strength and momentum for a group of stocks. In the above chart, they show relative performance against NIFTY500 Index (Broader Markets) and should not be used directly as buy or sell signals.
Milan Vaishnav, CMT, MSTA
Consulting Technical Analyst,


