In a week that saw wide-ranging moves and a rally that was fueled by US elections, the Indian equities went on to end on a strong note. The week's trading range not only wide that of 723 points, but the previous days also saw volatility declining to a great extent. The bias of the markets over the past five days stayed secularly bullish and the financial stocks outperformed the front-line index along with the midcaps. By the end of the Friday session, the NIFTY ended with a net gain of 621.15 points (5.34%) on a weekly basis.
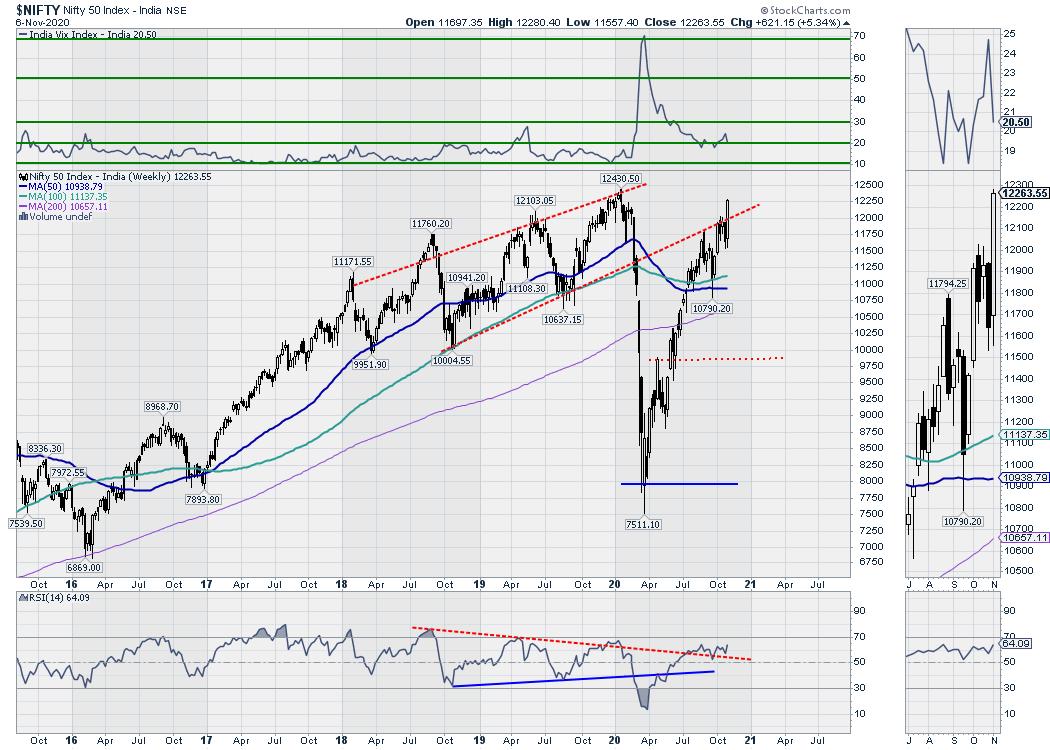
Analyzing the markets in a traditional way through just domestic setup would be meaningless. The rally that we saw over the past five days had been inherited from the global trade setup and the buoyancy fueled by the US elections. Also, there is a slight difference in the technical setup as well between the Indian and the US markets. Before the current sharp rally, the Dow had tested its 200-DMA while the S&P 500 has bounced off from the 100-DMA. The Indian benchmark NIFTY 50 has been relatively very strong and it has bounced back from its 50-DMA while not going even near to the other two DMAs.
This shows that the Indian markets have run up a little more than the US markets, as it also additionally benefitted from the weakness in the US Dollar that has led to Dollar-driven liquidity infusion in the emerging markets. Going ahead, we expect this rally to stall a bit and there are chances that the markets consolidate a bit and to stay healthy. The volatility dropped significantly as the INDIAVIX came off by 17.19% to 20.50 on a weekly basis.
The coming week will see the levels of 12350 and 12500 acting as resistance. The supports will come at the 12150 and 11950 levels. The trading is expected to stay wider in the coming week.
The weekly RSI is 64.09; it shows a mild bearish divergence against the price. The weekly MACD is bullish and trades above the signal line. The formation of a large white candle denotes the unilateral up move that happened on the upside.
The NIFTY has completed its V-shaped recovery and has regained everything that it had lost during the pandemic meltdown. This is, by all means, a phenomenal show and, also, the time that we continue to exercise some caution while chasing the up moves. The sectoral preference is evident towards the traditionally defensive stocks like Consumption, FMCG and IT. Even if the IT consolidates at the present moment, it is expected to catch up once the Dollar weakness stops. We reiterate continuing to stay stock-specific and avoid chasing the momentum blindly.
Sector Analysis for the Coming Week
In our look at Relative Rotation Graphs®, we compared various sectors against CNX500 (NIFTY 500 Index), which represents over 95% of the free float market cap of all the stocks listed.


The review of Relative Rotation Graphs (RRG) shows that the IT sector is the only sector which is placed in the leading quadrant and does not appear to be giving up on its relative momentum. There is no other sector which is currently placed in the leading quadrant.
The MIDCAP100 Index has rolled over into the weakening quadrant, showing the likely end of its relative outperformance. The NIFTY Auto, Media, Metal and Pharma index stay in the weakening quadrant. The Pharma index appears to be trying to improve on its relative momentum.
The Infra, PSE, PSU Banks, Commodities and Energy indexes continue to languish in the lagging quadrant. The FMCG and the Consumption group is also in the lagging quadrant, but it appears to be sharply improving on its relative momentum and is in the process of bottoming out.
The NIFTY Financial services, BankNifty and Service sector indexes are in the improving quadrant and doing steady, except for the Realty group which is paring its momentum sharply. We will see these sectors, along with IT, FMCG and Consumption packs, offering stock-specific relative outperformance over the coming days.
Important Note: RRG™ charts show the relative strength and momentum for a group of stocks. In the above chart, they show relative performance against NIFTY500 Index (Broader Markets) and should not be used directly as buy or sell signals.
Milan Vaishnav, CMT, MSTA
Consulting Technical Analyst,


