In a yet another gainful week for the markets, the Indian equities extended their move on the upside and posted decent weekly gains. The past five days saw the NIFTY moving higher and closing at its lifetime high levels. As compared to the week before this one, the trading range remained lower as the NIFTY oscillated in the range of 400-odd points as compared to 723 points. The decline in the volatility, though, was arrested and some sectoral shifts were clearly visible. After a stable move on the higher side, the headline NIFTY index ended with a net gain of 456.40 points (+3.72%) on a weekly basis.
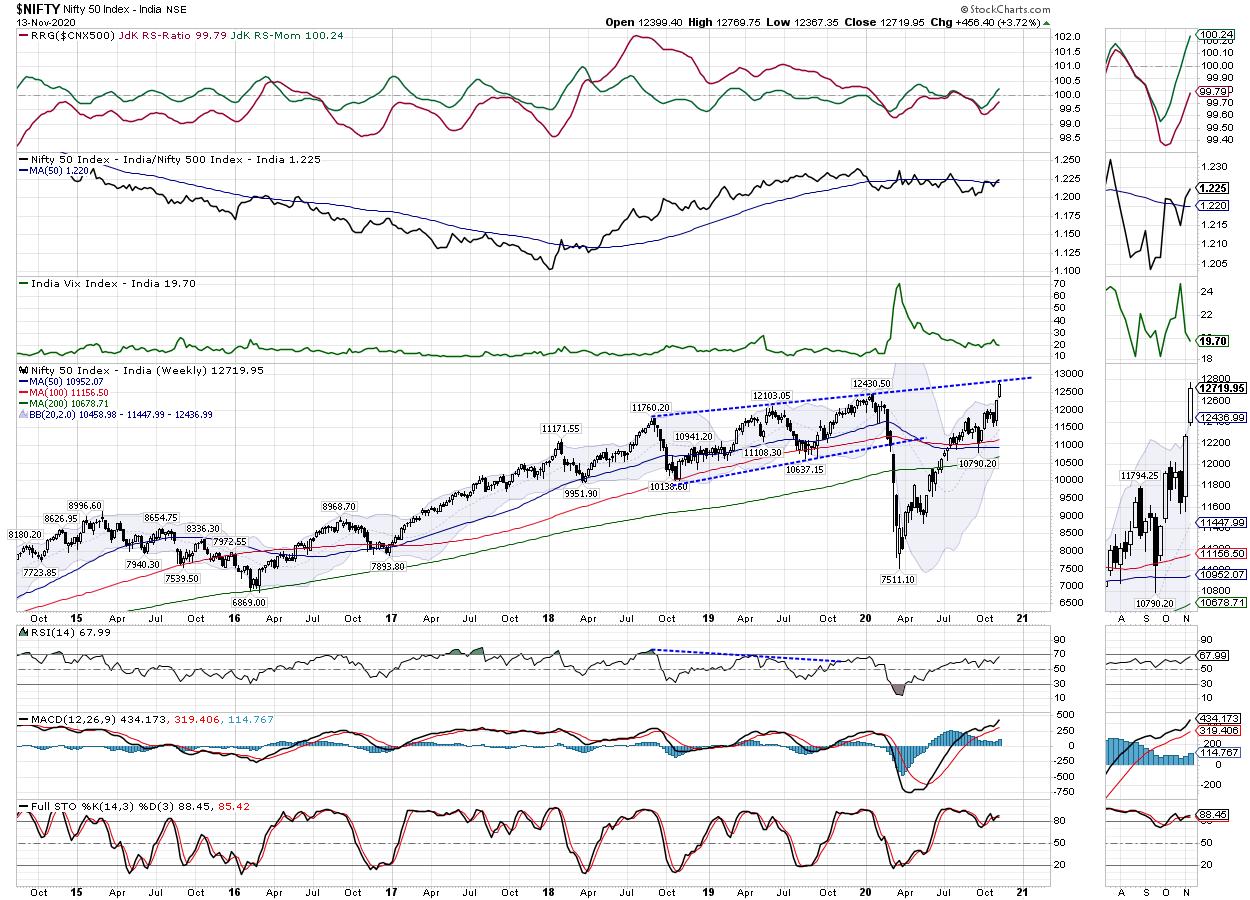
We are two weeks into the month and the NIFTY has gained 1077.55 points (+9.26%) so far on a month-to-date basis. Also, the Index tested a two-year-long trend line pattern resistance, which makes the current move and the previous week's level crucially important to watch. The volatility, which came off 17.19% over the previous week, stayed steady, but still ended at 19.70, coming off by 3.88% on a weekly basis. The NIFTY is now in uncharted territory and, as it meets a strong pattern resistance, its behavior against the trend line would be important to watch.
The NIFTY will have a short trading session on Saturday on account of "Mahurat Trading." Such sessions are usually quiet, with some token trades placed by the participants.
The coming week will see the levels of 12850 and 13000 acting as resistance points. The supports will come in lower at the 12610 and 12400 levels. There are possibilities of the trading range getting wider this week, with some rise in overall volatility.
The weekly RSI is 67.99. It has marked a new 14-period high, which is bullish and does not show any divergence against the price over this look-back period. The weekly MACD is bullish as it stays above the signal line.
A white candle occurred on the chart. This showed consensus of the participants with regard to the directional bias of the markets during the week.
Going by the pattern analysis, it is evident that the NIFTY has now gained more than what it had lost during the pandemic meltdown. It now trades at a lifetime high point; at the same time, it has tested the 2-year long important pattern trend line resistance on the weekly charts. This makes the price action of the index against this trend line crucial to watch.
If the markets in general take a breather over the coming week, that should not come as a surprise as the NIFTY has runup too fast over the previous days, much ahead of the curve. For the markets to sustain these gains, it would be healthy if it consolidates at current levels. Over the past several days, some sharp sector preferences were seen which point toward some onset of defensive bets in the markets. We recommend adopting a highly stock- and sector-specific approach rather than giving a blind chase to the momentum.
Sector Analysis for the Coming Week
In our look at Relative Rotation Graphs®, we compared various sectors against CNX500 (NIFTY 500 Index), which represents over 95% of the free float market cap of all the stocks listed.
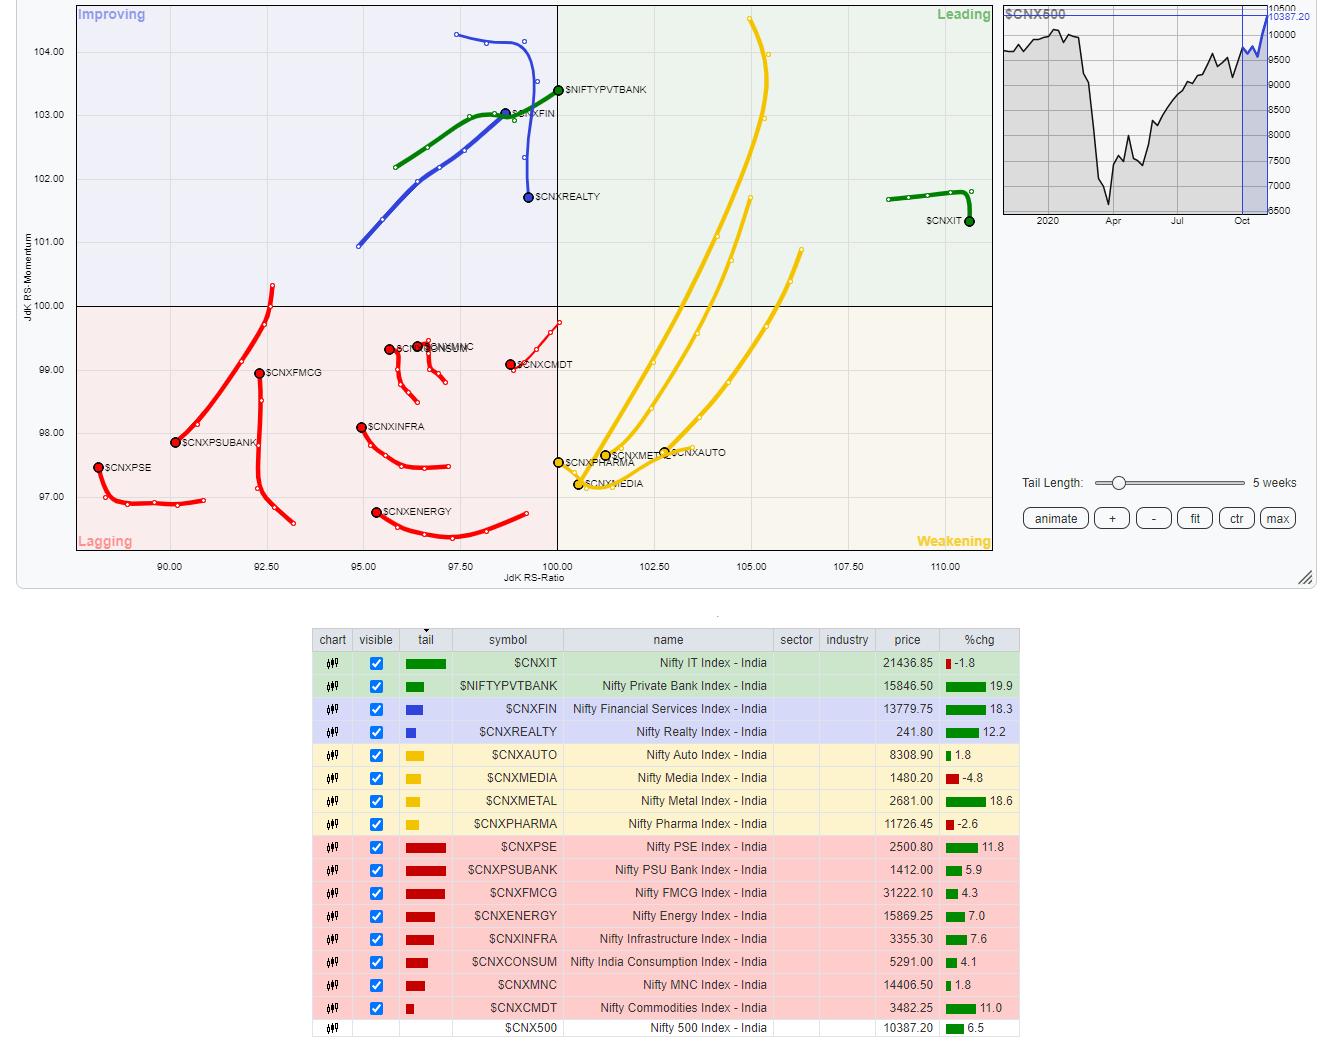
The review of Relative Rotation Graphs (RRG) shows an absence of sectors in the leading quadrant. NIFTY Services sector is the only one as of now; it is in the leading quadrant and also rotating favorably in the north-easterly rotation. The IT Sector is in the leading quadrant as well, but it has shown some paring of relative momentum over the previous week. However, these two groups are likely to post relative outperformance over the broader markets.
The NIFTY Metal, Media and Pharma and Auto indexes are in the weakening quadrant along with the broader NIFTY Midcap 100 index. Inside the lagging quadrant, there are Consumption, Commodities, Energy, FMCG, Infra, PSE and PSU Bank indexes. The weakest among these is the PSU bank index, which is rotating southwest while staying in the lagging quadrant. The FMCG, Consumption and Infrastructure are attempting to consolidate their performances.
The NIFTY Realty index appears to be rolling over following a weak rotation inside the improving quadrant. Meanwhile, the NIFTY Bank remains strong and is advancing towards the leading quadrant. Currently, it is placed inside the improving quadrant. Given this, NIFTY Bank is accompanying the NIFTY Financial Services Index, which appears to be firmly placed inside the improving quadrant.
Important Note: RRG™ charts show the relative strength and momentum for a group of stocks. In the above chart, they show relative performance against NIFTY500 Index (Broader Markets) and should not be used directly as buy or sell signals.
Milan Vaishnav, CMT, MSTA
Consulting Technical Analyst


