In what was a sixth consecutive week of gains, the Indian equities continued with their up move and extended their gains. It was a measured move ahead for the markets, which went on to close with fresh lifetime highs once again. The trading range over the past five days was a bit narrower than the week prior. The headline index oscillated in a range of 338-points, but saw some volatility resurfacing again. After a measured move and some extended gains, the NIFTY ended with a net gain of 255.30 points (+1.93%) on a weekly basis.
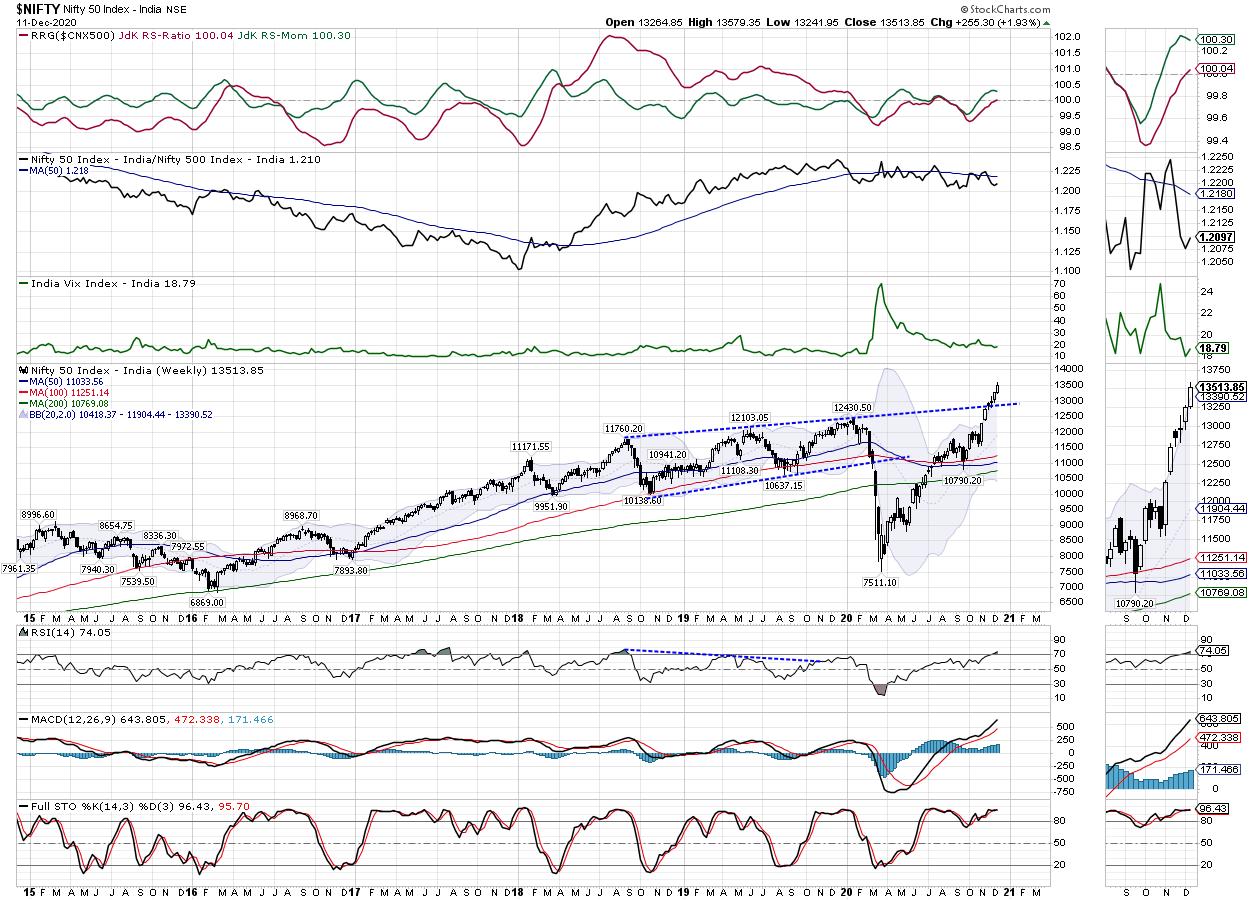
Looking at shorter timeframe daily charts, the NIFTY looks highly overstretched and overextended, which makes it prone to some profit-taking moves from current levels. On the weekly timeframe, it does not look as overstretched; this may lead to some consolidation in a range-bound manner. The present rally continues to be fueled by a weak US Dollar, resulting in strong FII inflows. Keeping a close eye on DXY (Dollar Index) is needed, as it now stays highly oversold and just a notch away from its strong multi-year support. Volatility resurfaced a bit as the INDIAVIX climbed by 4.23% to 18.79 on a weekly note.
The coming week can see measured moves and limited upsides by the markets as some consolidation cannot be ruled out. The levels of 13600 and 13665 may act as resistance points. The supports come in much lower at the 13380 and 13210 levels. Any corrective move, if at all it happens, will make the trading range wider for the week.
The weekly RSI is 74.05; it has made a new 14-period high and this is bullish. RSI is overbought but stays neutral and does not show any divergence against the price. The weekly MACD is bullish and remains above the signal line. A white body emerged on the candle; this implies a directional consensus among the participants and usually implies an established trend unless reversed.
While having a look at pattern analysis, it shows that the NIFTY has gained much more than what it lost during the pandemic meltdown. In the process, the Index has also crossed and moved past the 2-yr long rising trend line which ought to have acted as a strong pattern resistance. This has ensured that the NIFTY has shifted its support levels higher.
As we approach the coming week, we recommend keeping a strong preference for defensives liked FMCG, Pharma, Consumption and some PSUs, which are showing strong sector rotation. If the Dollar Index pulls up a bit, which may lead to Rupee depreciation, this may play out tactically well for select IT stocks as well. We reiterate approaching the markets with utmost caution; avoid taking excessive large leveraged exposures as the NIFTY remains prone to some corrective moves.
Sector Analysis for the Coming Week
In our look at Relative Rotation Graphs®, we compared various sectors against CNX500 (NIFTY 500 Index), which represents over 95% of the free float market cap of all the stocks listed.
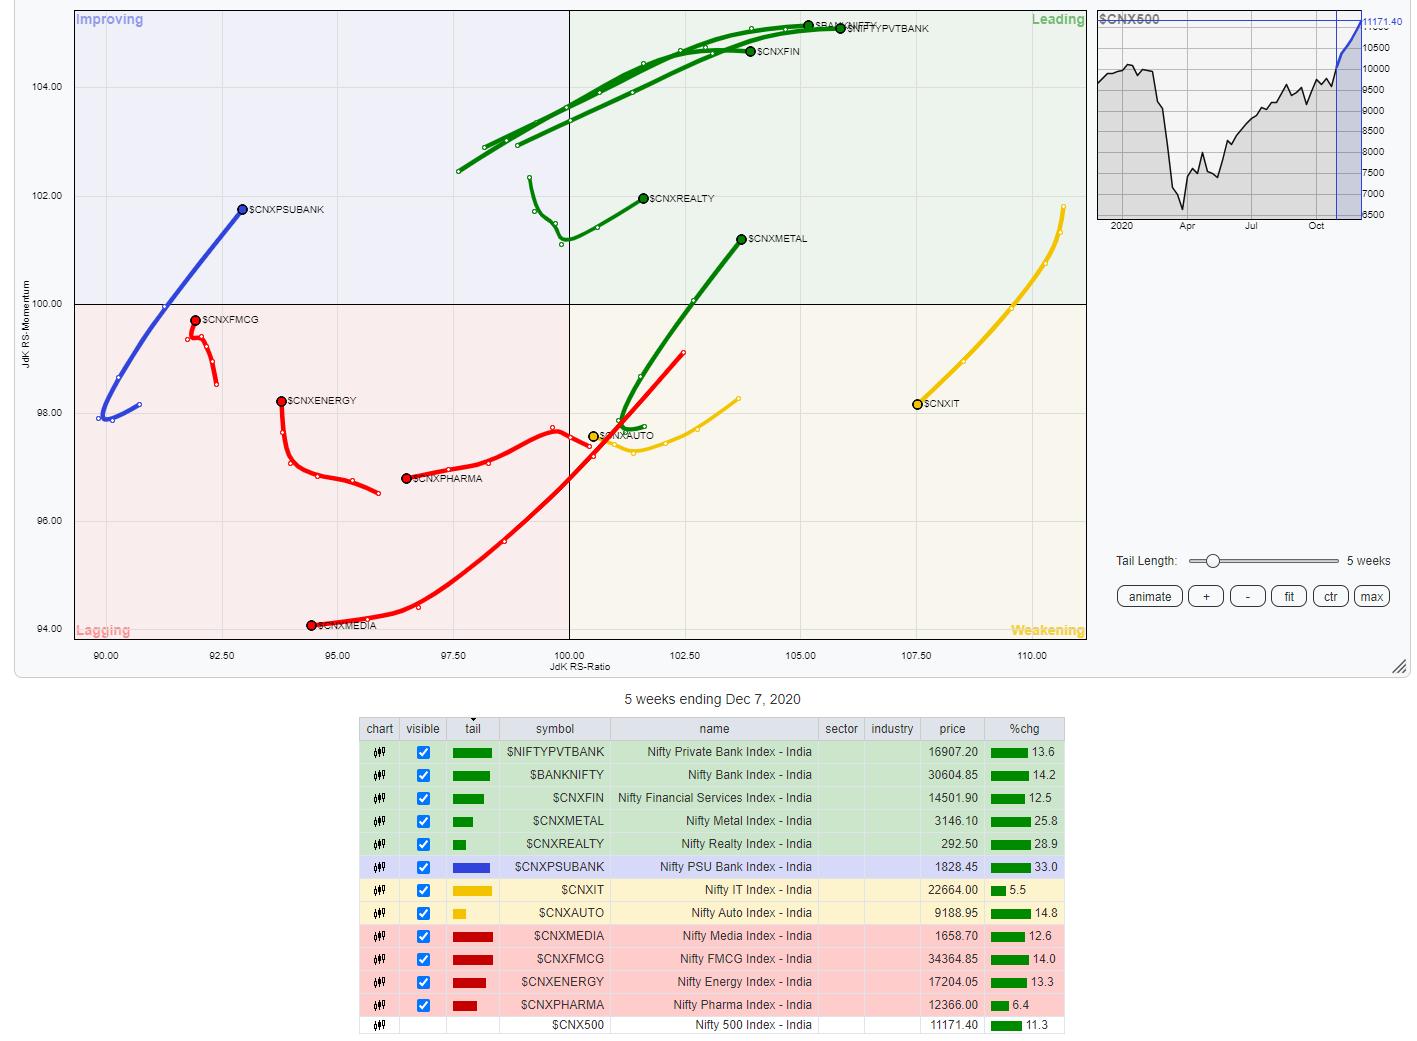
The review of Relative Rotation Graphs (RRG) shows that the Nifty Bank, Services Sector Index, Realty, and Financial services sector indices are placed in the leading quadrant. NIFTY Metal has also rotated strongly back inside the leading quadrant. These groups are set to relatively outperform the broader NIFTY500 Index.
Though the NIFTY Midcap 100 Index is in the weakening quadrant, it is looking up as it improved its relative momentum over the previous week. The IT and AUTO indexes remain in the weakening quadrant.
NIFTY Pharma and Media languish in the weakening quadrant, though they have flattened themselves as they attempt to consolidate. However, the NIFTY Infra, Energy, FMCG, and Consumption indexes, also in the lagging quadrant, appear to be sharply improving on their relative momentum and are seen moving towards the improving quadrant.
The NIFTY PSE Index has rolled over inside the improving quadrant, signaling a likely end to its relative underperformance. NIFTY PSU Bank Index continues to advance inside the improving quadrant, maintaining its strong north-easterly rotation.
Important Note: RRG™ charts show the relative strength and momentum for a group of stocks. In the above chart, they show relative performance against NIFTY500 Index (Broader Markets) and should not be used directly as buy or sell signals.
Milan Vaishnav, CMT, MSTA
Consulting Technical Analyst,


