Over the past five days, the Indian equities continued with their measured up move and went on to pile up some more incremental gains. After some brief consolidation in the beginning of the week, the NIFTY went on to mark fresh lifetime closing highs each day as the liquidity continued chasing the equities. The Dollar Index stayed weak, which fueled the FII inflows to the emerging markets in general. The headline index saw itself oscillating in a 326-point range, ending with a net gain of 246.70 points (+1.83%) on a weekly basis. It is notable that this was the seventh straight week of gains for the markets.
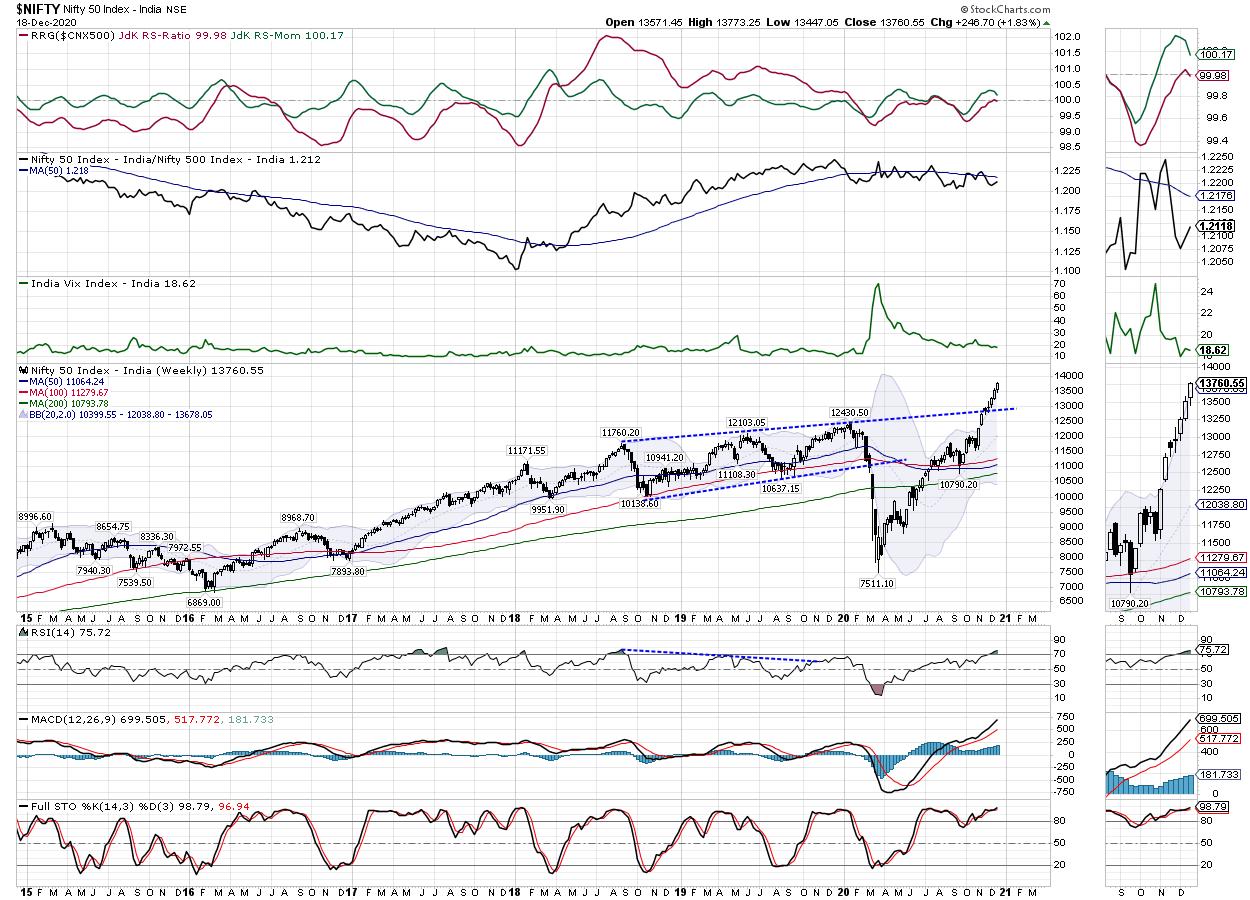
The coming week is a shortened 4-day week, with Friday being a trading holiday on account of Christmas. If we read the charts in isolation, the Index is now highly overstretched on both daily and weekly timeframes. It is a different thing that the weak Dollar is continuing to fuel the FII inflows, and this liquidity is chasing the markets. Keeping a keen eye on these things will be crucial as the markets are now overdue for some healthy consolidation, if not any major corrective moves. Staying invested in the right sector would be the key thing to better handle this technical setup.
Volatility stayed subdued; INDIAVIX declined marginally by 0.89% to 18.62.
The coming week may see some consolidation happening, as a result of which the trading range could get a bit wider. The levels 13850 and 14000 may act as resistance points. The supports can come in at the 13600 and 13480 levels.
The weekly RSI is 75.72. It has marked a new 14-period high, which is bullish; it remains neutral and does not show any divergence against the price. The RSI also remains in the overbought territory. The weekly MACD is bullish; it is above its signal line. A white body emerged on the candles; it simply reflects a directional consensus of the market participants.
The pattern analysis of the weekly charts shows the NIFTY has taken out the 2-year-old rising trend line as it moved past the 13000 levels. Although the Index is now clearly overextended, it has shifted its supports much higher to the 13000 levels in the event of any broad consolidation or corrective moves happening.
The sector rotation in the markets is quite evident, with the traditionally defensive sectors like FMCG, Consumption, Pharma and IT looking up. With the liquidity fueling the momentum, it would be prudent to approach the markets in a highly sector- and stock-specific manner. Adopting such an approach will help mitigate risks in the event of any broad consolidation happening in the markets. While avoiding both shorts and excessive leveraged exposures, a highly selective approach is advised over the coming week.
Sector Analysis for the Coming Week
In our look at Relative Rotation Graphs®, we compared various sectors against CNX500 (NIFTY 500 Index), which represents over 95% of the free float market cap of all the stocks listed.
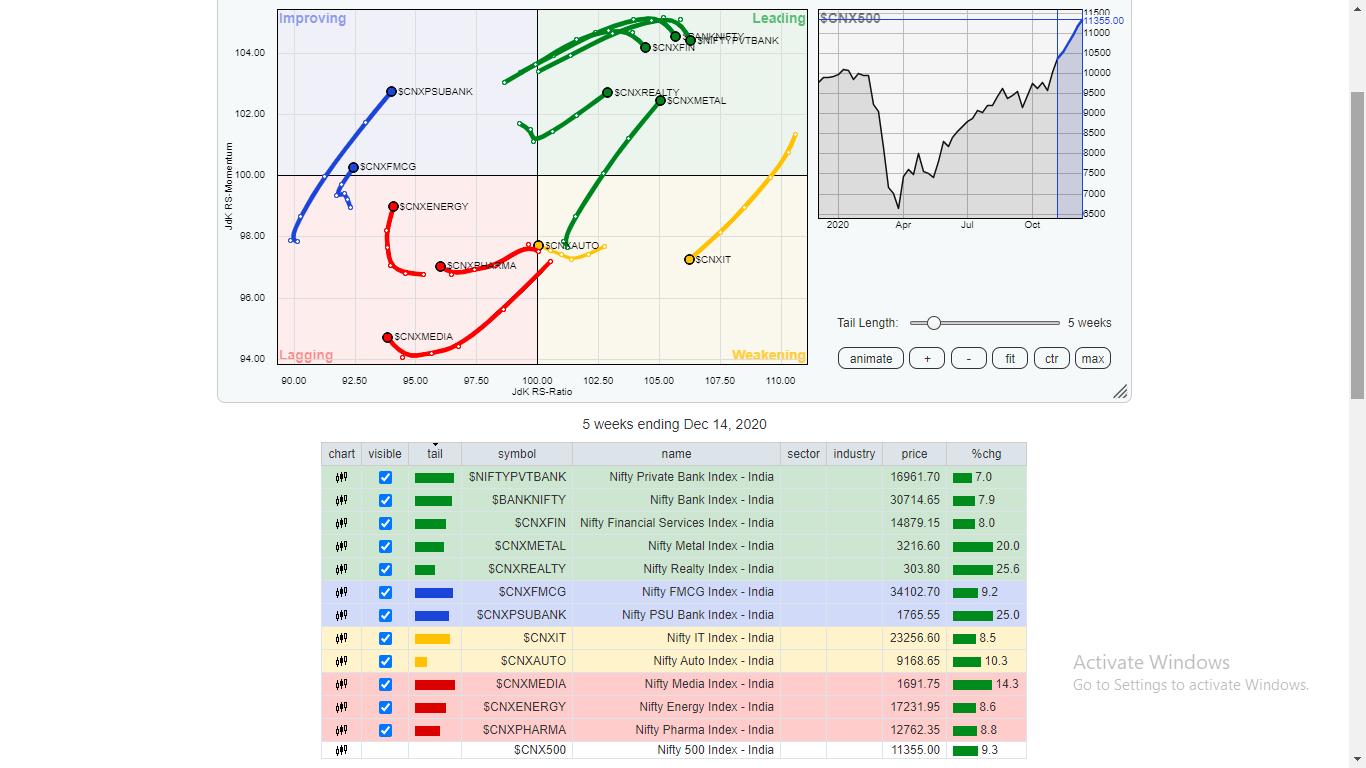
The review of Relative Rotation Graphs (RRG) shows some clear sector rotation happening in the markets. With the high beta still leading the way, the baton is clearly shifting to some defensive sectors as well.
NIFTY Financial Services, BankNifty, the Services sector, Realty and the Metal Indexes are in the leading quadrant. Except for the Metal Index, these are slightly slowing down in terms of relative momentum. However, the groups will continue to stay relatively strong against the broader markets.
NIFTY IT continues to remain in the weakening quadrant. NIFTY MidCap 100 Index is also in the weakening quadrant, but it appears to be taking a U-turn to roll over again in the leading quadrant. NIFTY Auto also remains in the leading quadrant, but is seen mildly improving on its relative momentum.
NIFTY Energy, NIFTY Pharma and Media are in the lagging quadrant. However, they have started improving on their relative momentum. FMCG and Consumption have rolled over inside the improving quadrant, along with the NIFTY Infrastructure index. In addition to these groups, the PSU Banks and PSE Index remain firm inside the improving quadrant.
Important Note: RRG™ charts show the relative strength and momentum for a group of stocks. In the above chart, they show relative performance against NIFTY500 Index (Broader Markets) and should not be used directly as buy or sell signals.
Milan Vaishnav, CMT, MSTA
Consulting Technical Analyst,


