In a week that was a bit more volatile than the previous one, the Indian equities continued with their up move, ending once again on a lifetime high point. The trading range also widened over the past five sessions as the Index oscillated in the range of 414 points. On the anticipated lines, the markets did witness some intermittent profit-taking bouts, but all those selloffs were ultimately bought at lower levels. However, this led to an increase in the volatility of the previous week. Following the days of ranged corrective moves and some advancement of levels on the broader terms, the headline Index finally ended with net gains of 328.75 points (+2.35%).
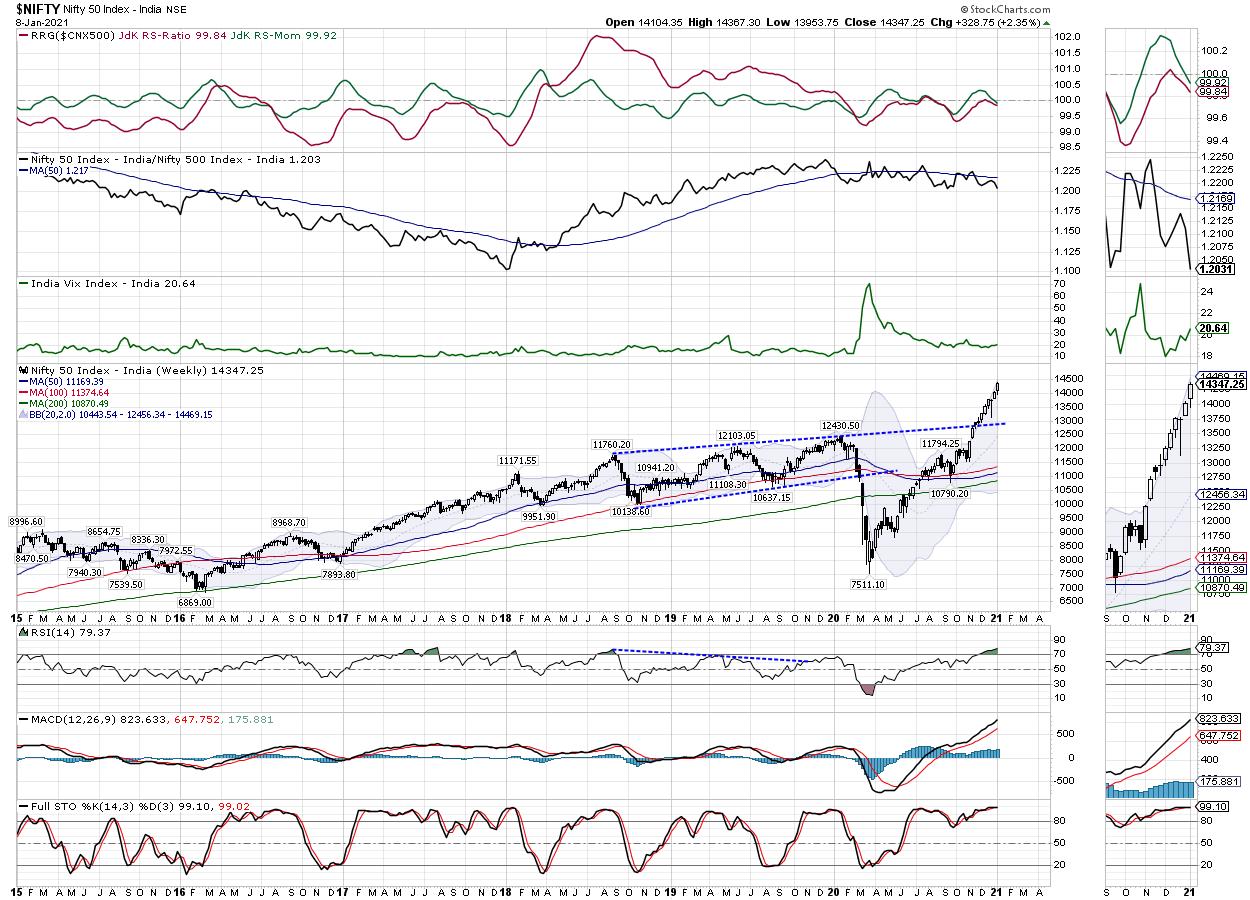
The markets are showing massively strong undercurrents over the past quarter. Over the past 10 weeks, the NIFTY gained over 2800-odd points; and 9 out of 10 weeks have ended with weekly gains. The only one week that had a negative ending was that of just 11-odd points. Such is the strength of the markets. However, despite this, we cannot disregard the terribly overstretched technical setup on the weekly charts. The Markets are overbought, and the spike in US 10-YR Bond Yields and any technical pullback in the US Dollar will subject the equity markets to some hiccups.
The coming week is likely to be a wide-ranging one. The derivative data suggests piling up of heavy long positions. The PCR of over 1.70 is on the threshold of getting overbought, but it stands for a buoyant setup at this moment. The levels of 14450 and 14550 will pose resistance at higher levels. The supports will come in at lower at the 14150 and 13930 levels.
The weekly RSI stands at 77.38; it is grossly overbought, but remains neutral as it does not show any divergence against the price. The weekly MACD is bullish and remains above the signal line.
The pattern analysis of the weekly chart reveals that it has broken out afresh after the NIFTY took out the 13700-13750 levels. If the price implications are measured following this breakout, it has almost achieved the expected levels. However, there is some gap and space left for some minor upsides; that would complete the price level targets following the most recent breakout.
All in all, the trend stays strong, which is what matters as we chase the momentum. However, we may continue to follow the trend, which is obviously and strongly on the upside, but we need to chase the momentum keeping the broader picture in mind. We reiterate that in this time, it is all the more important to stay with the defensive sectors and avoid high-beta stocks that have run up too hard and too fast. We recommend continuing to approach the markets cautiously and keeping overall exposures at modest levels.
Sector Analysis for the Coming Week
In our look at Relative Rotation Graphs®, we compared various sectors against CNX500 (NIFTY 500 Index), which represents over 95% of the free float market cap of all the stocks listed.
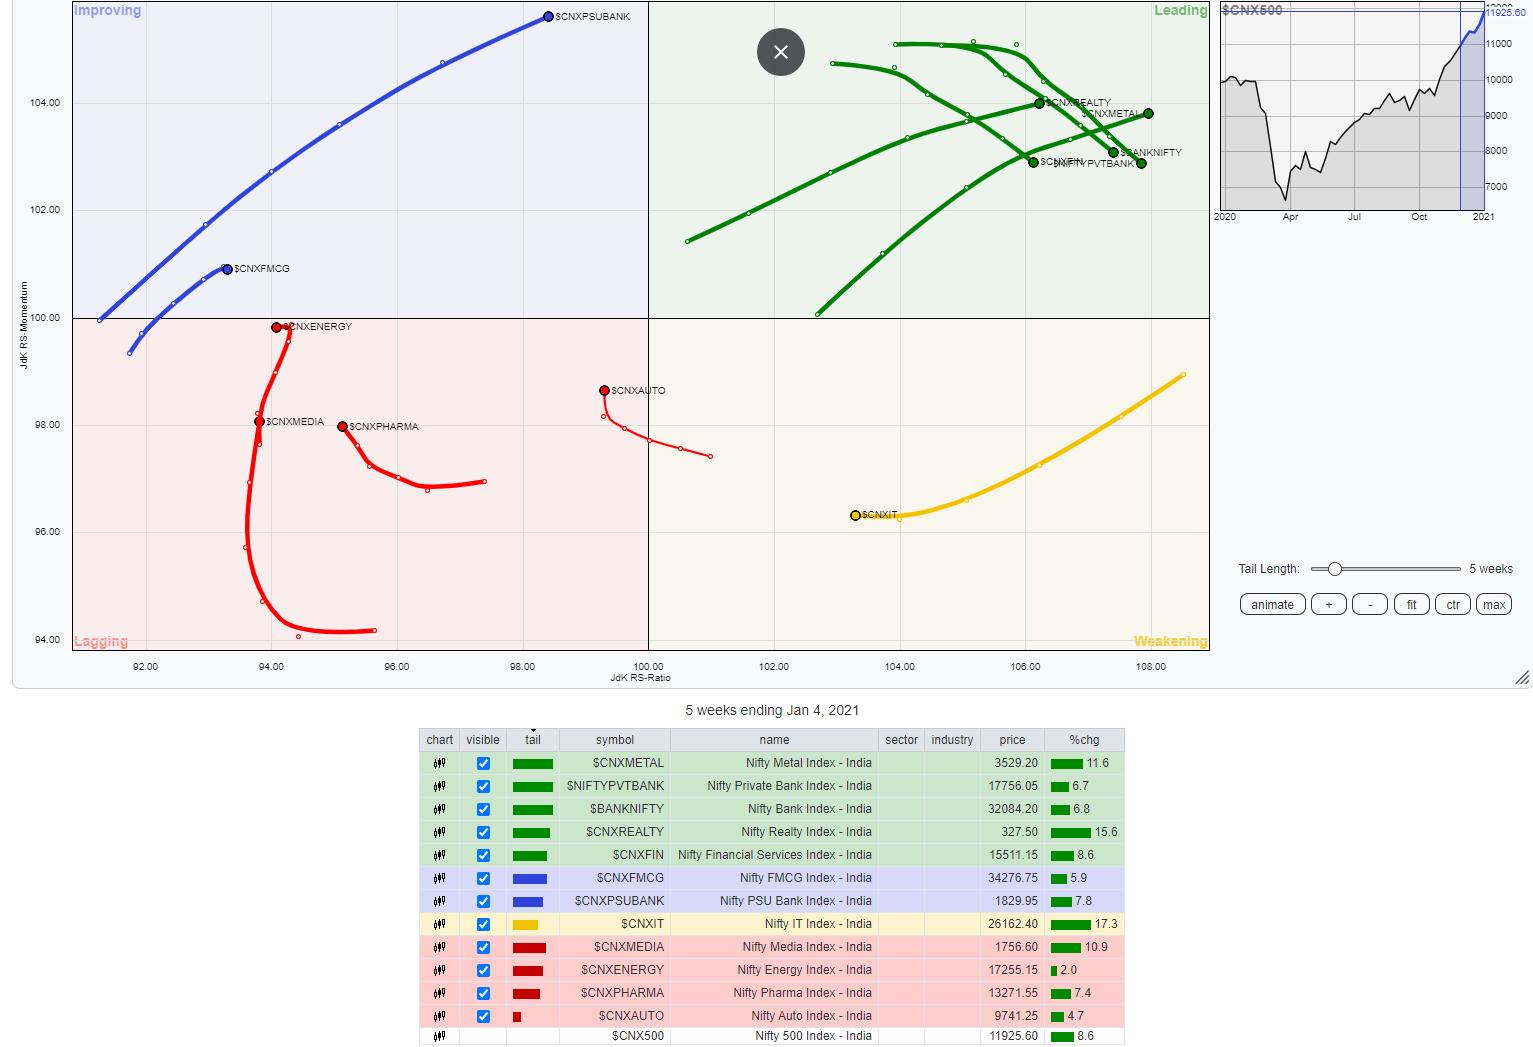
The review of Relative Rotation Graphs (RRG) shows that, while the NIFTY Metal and Realty stays firmly placed in the leading quadrant, the NIFTY Services, Financial Services, BankNifty and the Commodities appear to be taking a breather despite being placed in the leading quadrant.
The NIFTY IT index is the only one in the weakening quadrant; however, it is not rotating in the bearish southwest direction, but appears to be looking up again. It has shown some improvement on the relative momentum front.
The NIFTY Pharma, Media and Auto Indexes are in the lagging quadrant. However, they are all improving on their relative momentum front in a near-vertical manner. Only the Energy Index has apparently temporarily snapped its improvement streak over the previous week. It remains in the lagging quadrant as of now.
The FMCG index is in the improving quadrant and looks like it has taken a breather. Apart from this, the Consumption, PSU Banks, PSE and Infrastructure indexes are firmly placed inside the improving quadrant and are continuing with their healthy north-easterly rotation while maintaining their relative momentum against the broader NIFTY500 index.
Important Note: RRG™ charts show the relative strength and momentum for a group of stocks. In the above chart, they show relative performance against NIFTY500 Index (Broader Markets) and should not be used directly as buy or sell signals.
Milan Vaishnav, CMT, MSTA
Consulting Technical Analyst,


