Although the Indian equity markets extended their weekly gains, they showed the first signs of impending broad consolidation, spending much of the last three days correcting from the higher levels. The start to the week was buoyant; however, after marking the week's high at 14653, the NIFTY continued witnessing a profit taking bout from each higher level it saw subsequently. The trading range did not expand much on either side, but the volatility did surge. Despite a volatile five days of trading, the headline Index NIFTY closed with net gains of 86.45 points (+0.60%) on a weekly basis.
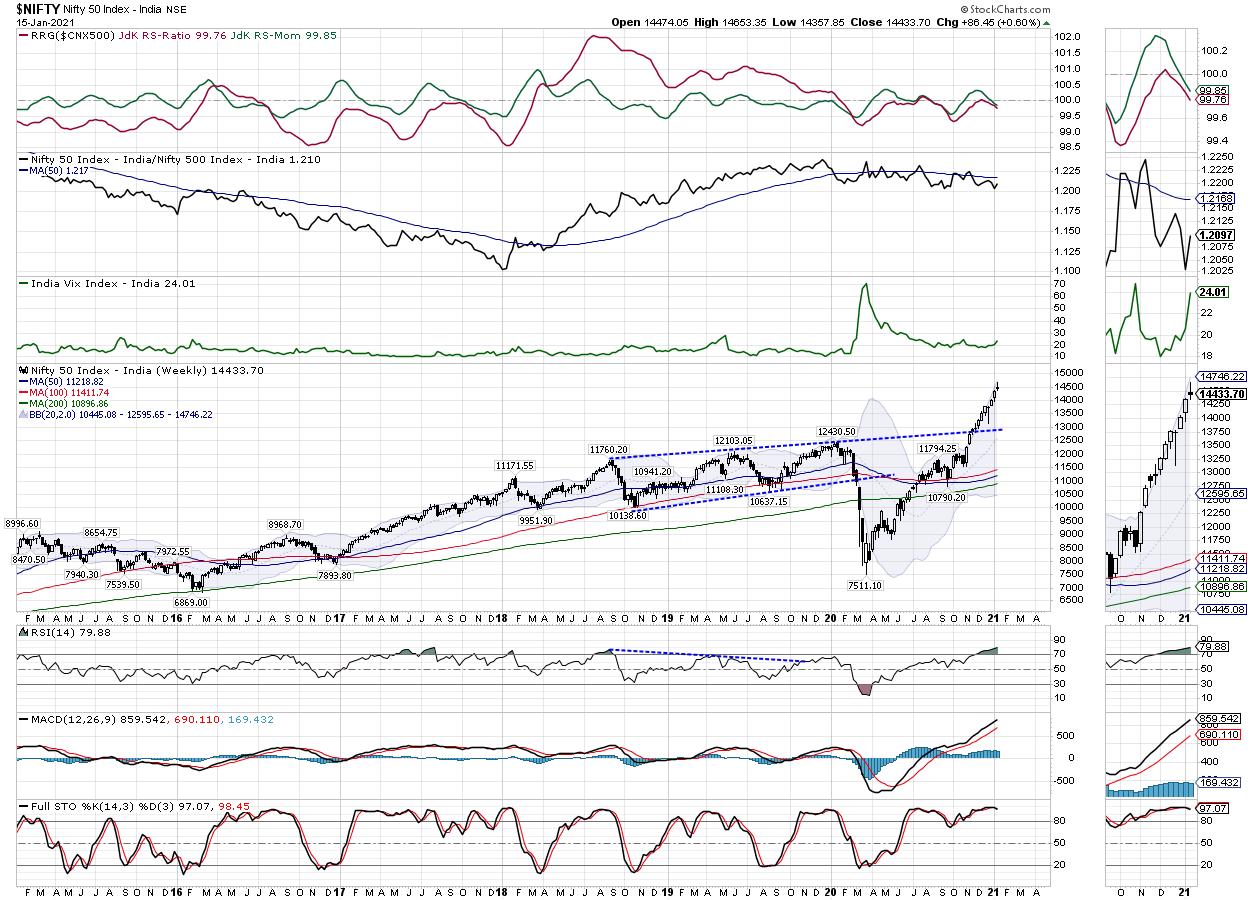
There is no disputing the fact that the markets have demonstrated very strong undercurrents. The US Dollar will remain weak following a large stimulus from the new US Government. All this will continue fueling liquidity in the emerging markets in general. The buoyancy of the markets can be gauged from 10 positive weekly closes out of the past 11 weeks. However, this being said, the overbought and overextended structure of the charts may push markets into some more consolidation. Fresh up moves shall come only if NIFTY manages to move past the 14650-mark. The volatility surged as INDIAVIX moved higher by 16.33% to 24.01.
The coming week may see the markets consolidating in a broad range for some time. The 14500 and 14675 levels will act as resistance points. The supports will come in at the 14285 and 14100 levels. The trading range is likely to get a bit wider than the previous week; volatility too is likely to be a little more.
The weekly RSI stands at 79.88; it remains in overbought territory above the levels of 70. The weekly MACD is bullish and stays above the signal line. A Shooting Star emerged on the Candles. This is a classical shooting star as the week opened higher than the previous one, then moved even further up, but then corrected to end in the lower half of the candle, leaving a long upper shadow on the upside. This has marked the level of 14653 as an intermediate top for the markets for the near term, unless taken out convincingly.
The pattern analysis reveals that the Index has extended itself much higher following a breakout from the 12800-12850 zone. This has raised the support much higher at 13000 given the rising nature of the trend line that NIFTY took out while achieving a breakout.
Overall, the NIFTY has overextended itself and has largely deviated from the mean. Even the nearest 20-week MA is at 12595. The Bollinger bands have gotten much wider than normal and the possibility of the NIFTY returning to its normal range cannot be ruled out.
All in all, there is a high chance of the markets slipping into consolidation in the coming week. In the event of any extension of the up move, we strongly recommend sticking to only those stocks which are high-quality and high-liquidity, which have improving relative strength against the broader markets and which have not run-up too hard over the past weeks. This will help to keep the risk-reward profile less unfavorably skewed. While continuing to stay highly stock-specific, vigilant protection of profits is advised at current levels.
Sector Analysis for the Coming Week
In our look at Relative Rotation Graphs®, we compared various sectors against CNX500 (NIFTY 500 Index), which represents over 95% of the free float market cap of all the stocks listed.
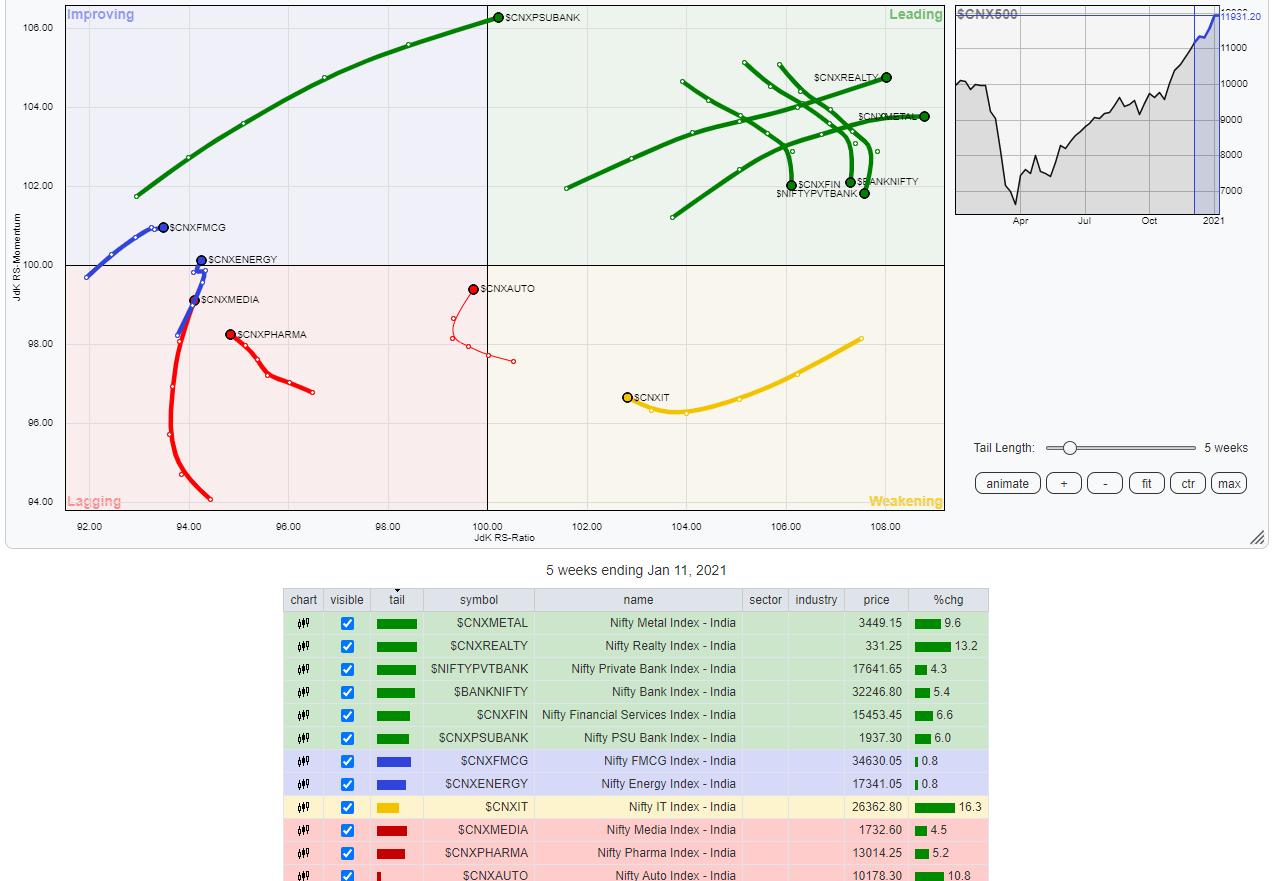
The review of Relative Rotation Graphs (RRG) shows that, despite staying in the leading quadrant, NIFTYBank, NIFTY Services Sector and Financial Services sector indexes are seeing near-vertical paring of relative momentum on the charts. Apart from this, the NIFTY Realty, Commodities, NIFTY MidCap100 and Metal Indexes are firmly placed in the leading quadrant. Also, the NIFTY PSUBank Index has entered the leading quadrant.
The only sector that is present in the weakening quadrant is the IT Index. However, this appears to be improving on its relative momentum. The NIFTY Media and Auto Indexes are in the lagging quadrant; however, they also appear to be sharply improving on the relative momentum front. The NIFTY Pharma Index is also placed in the lagging quadrant, but it looks as if it is taking a breather and is in the process of completing its consolidation period.
The NIFTY Energy Index has entered the improving quadrant following the JdK Momentum rising above 100. This marks a probable end to the relative underperformance of this group. The NIFTY FMCG, Consumption, Infrastructure and PSE Indexes are also placed in the improving quadrant and appear to be rotating favorably, maintaining their north-east trajectory.
Important Note: RRG™ charts show the relative strength and momentum for a group of stocks. In the above chart, they show relative performance against NIFTY500 Index (Broader Markets) and should not be used directly as buy or sell signals.
Milan Vaishnav, CMT, MSTA
Consulting Technical Analyst,


