Both the trend and the sentiment in the equity markets were affected due to a spike in the US Treasury Bond yields, which had its obvious effect on the emerging markets in general. The spikes and the strengthening US Dollar index caused some gap down opening and corrective moves in the Indian equity markets, particularly in the second half of the week. However, following a 635-point wide trading range over the previous five days and despite having negative closings in the last two sessions, the headline index NIFTY ended with net gains of 408.95 points (+2.81%) on a weekly basis, thus recovering nearly all of the previous week's losses.
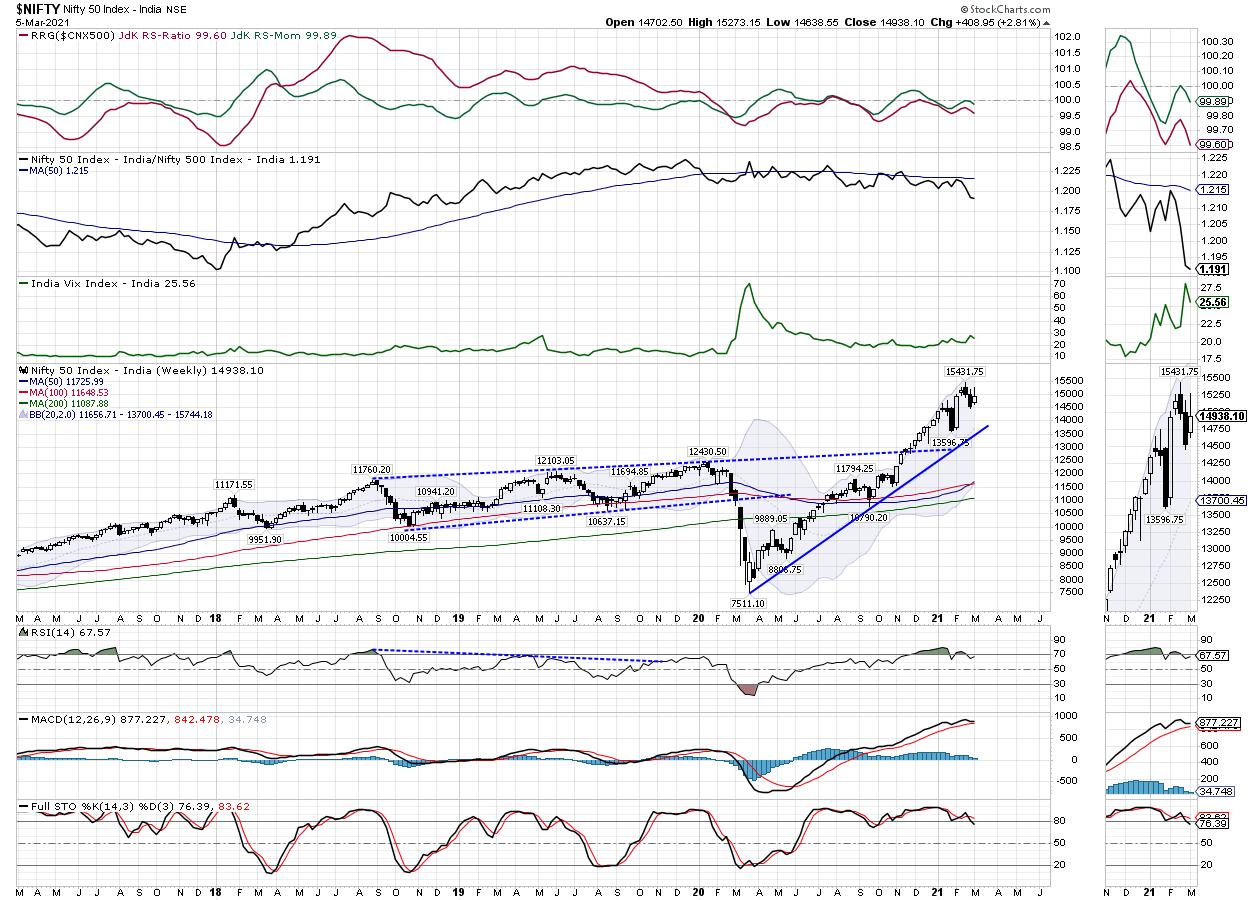
The volatility increased on a day-to-day basis; however, on a weekly note, the INDIAVIX came off by 9.18% to 25.56. Although the Index had made a modestly higher top and a higher bottom, it still remains a ways off from 15431, which is the lifetime high and also a probable intermediate top for the Index. It is showing some classical signs of an impending consolidation and, therefore, all moves on the upside will continue to stay vulnerable to the sell-off at higher levels. More importantly, the sudden spikes in the US Bond Yields, along with the strong US Dollar, will continue to cast their shadow on the domestic equity markets.
The NIFTY PCR across all expiries stands at 1.12, which is quite healthy and keeps the markets evenly placed. To add to this, the previous two sessions have seen significant addition of short positions, as reflected by the increase in the Open Interest that has come along with the decline in the NIFTY. This will keep the coming week range-bound, with both upsides and downsides staying wide but not taking any directional cue. The levels of 15200 and 15365 will act as resistance; the supports will come in at 14900 and 14780 levels.
The weekly RSI is 67.57; it remains neutral and does not show any divergence against the price. The weekly MACD is bullish and remains above the signal line. However, as reflected by the narrowing slope of the histogram, the momentum is decelerating, which may result in a negative crossover over the coming weeks. A Harami occurred on the candles; however, this candle also has a long upper shadow. The occurrence of such a candle has the potential to disrupt the current trend and push the markets further into consolidation, subject to confirmation on the next bar on the charts.
The pattern analysis clearly shows the NIFTY having highly deviated from its immediate mean and to have run up much ahead of its curve. This becomes more apparent from the fastest 20-week MA, which is almost running along as a proxy trend line with the actual trend line drawn on the chart. The 20-week MA presently stands at 13700, which is a good 1238 points away from the current levels.
All and all, this has become a highly selective market, and there is a possibility of isolated outperformance showing up instead of any particular sector. Despite some broader relative weakness shown over the previous week, it is possible the defensive plays like FMCG, IT and Pharma will continue to show improving relative strength. Since the US Bond Yield spikes and strengthening Dollar will continue to have their overhang on the markets, we recommend staying highly selective, avoiding leveraged exposures on either side and protecting profits with every move in the markets.
Sector Analysis for the Coming Week
In our look at Relative Rotation Graphs®, we compared various sectors against CNX500 (NIFTY 500 Index), which represents over 95% of the free float market cap of all the stocks listed.
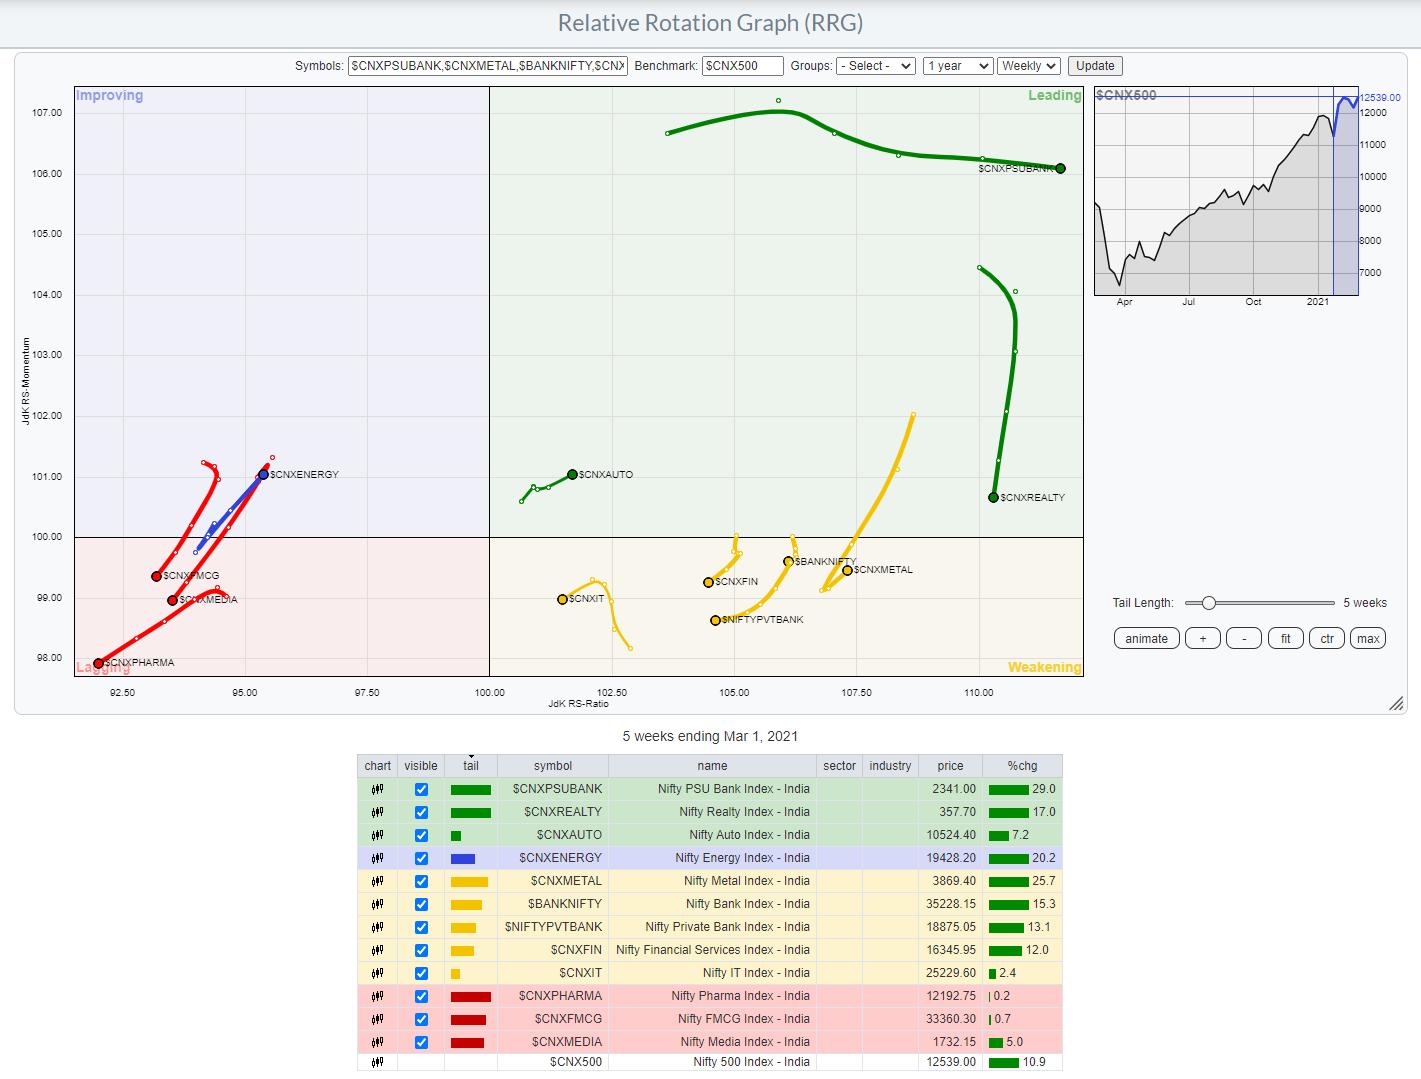
The review of Relative Rotation Graphs (RRG) shows a pretty interesting picture. The NIFTY MIDCAP 100 Index has rolled over back inside the leading quadrant. The Commodities Index has rolled over inside the leading quadrant. These groups, along with the Auto Index (which is also inside the leading quadrant) are likely to show relative outperformance against the broader markets. The Realty Index is seen losing its relative momentum and moving down towards the weakening quadrant.
The NIFTY Services, Metal, BankNifty, Financial Services and the IT Index are all placed inside the weakening quadrant. Despite some isolated stock-specific performances, broadly speaking, these groups may not contribute much to the overall performance in the markets. The FMCG, Consumption, Media and Pharma are all languishing inside the lagging quadrant. These groups may broadly underperform the broader markets.
NIFTY PSE and the Infrastructure Index are about to rollover inside the leading quadrant from the improving quadrant. Apart from this, the NIFTY Energy Index also appears to be making a strong move inside the improving quadrant while maintaining its relative momentum against the broader markets.
Important Note: RRG™ charts show the relative strength and momentum for a group of stocks. In the above chart, they show relative performance against NIFTY500 Index (Broader Markets) and should not be used directly as buy or sell signals.
Milan Vaishnav, CMT, MSTA
Consulting Technical Analyst,


